Verilink Access Manager 2000 (896-502037-001) Product Manual User Manual
Page 263
Reporting performance data
Access Manager 2000 User Manual
7
-13
For
S-Use
, only those intervals with at least one parameter
exceeding the specified thresholds are shown.
12. The bar chart is displayed. If intervals of data are missing in the
selected 24-hour interval, they appear as a solid block in the line
below the time axis. If the vertical bar (
|
) appears below the time
axis, it indicates there is no data after that time. If an asterisk (
*
)
appears at the top of a bar of data, it indicates the data is greater than
the top of the chart.
Steps 13 through 15 deal with editing the performance data filter
options.
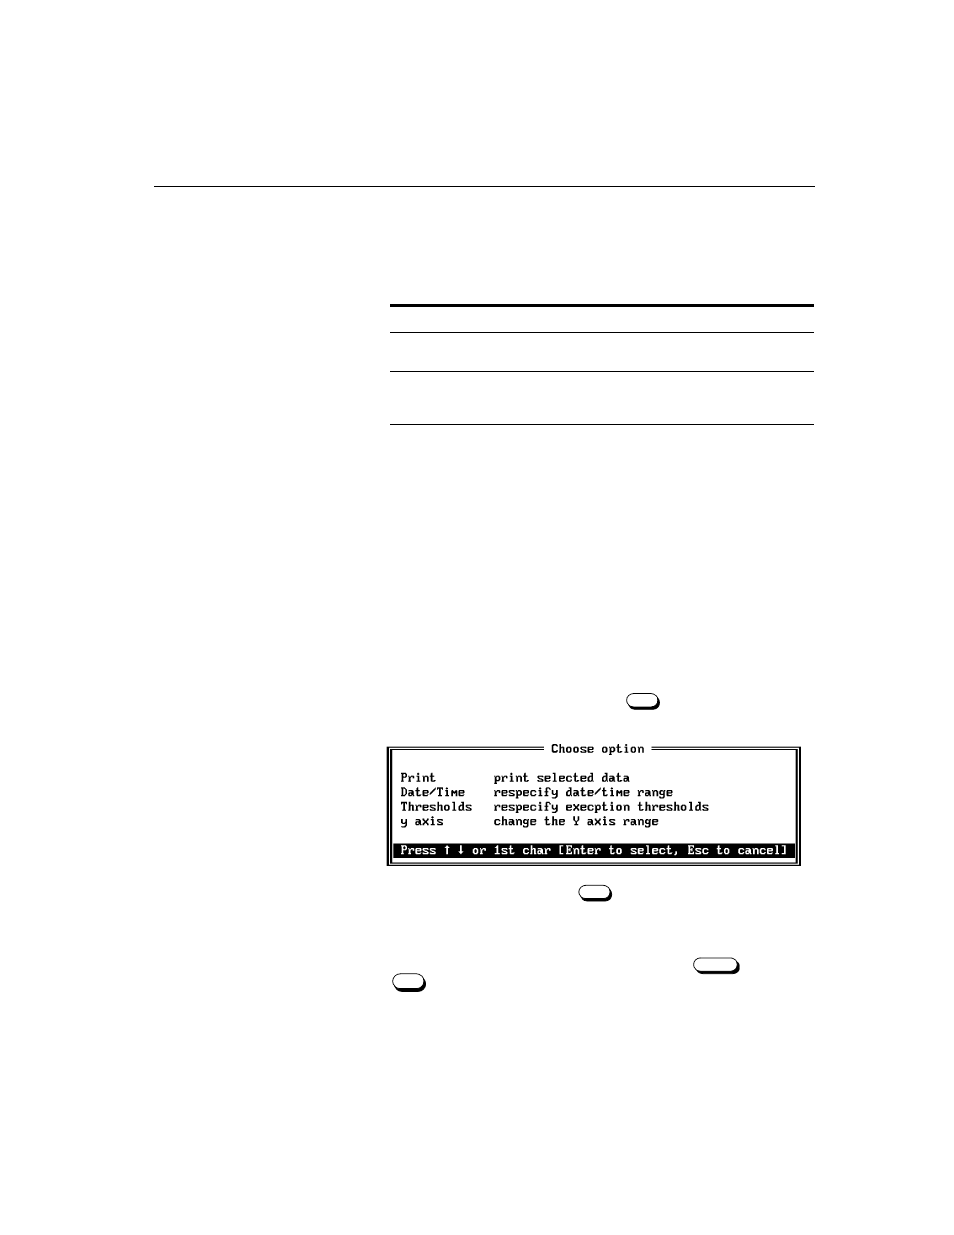
13. If you wish to change the options by which you analyze the selected
circuit element (including changing the Y-axis of the bar chart) or if
you want to print selected data, press
. The Choose Option
screen appears, showing numerous options.
This screen is available when
is pressed from Bar Chart
Display or from the Select A Circuit Element or Circuit Element
Detail screens. Not all options appear for all analyses.
14. Place the cursor on the desired option, and press
to select or
to cancel.
This in a data field
Means
. . . . (dots)
No data is available for that time interval.
N/A
The circuit element does not support that
type of data collection.
dis
Collection of performance data in the slot
was disabled for the period displayed
(AS2000 and ConnecT1 Plus only
F8
F8
Enter
Esc