Freezing levels, Freezing level overlay, Freezing – Jeppesen FliteDeck 3 User Manual
Page 228: Levels
Satellite Weather
231
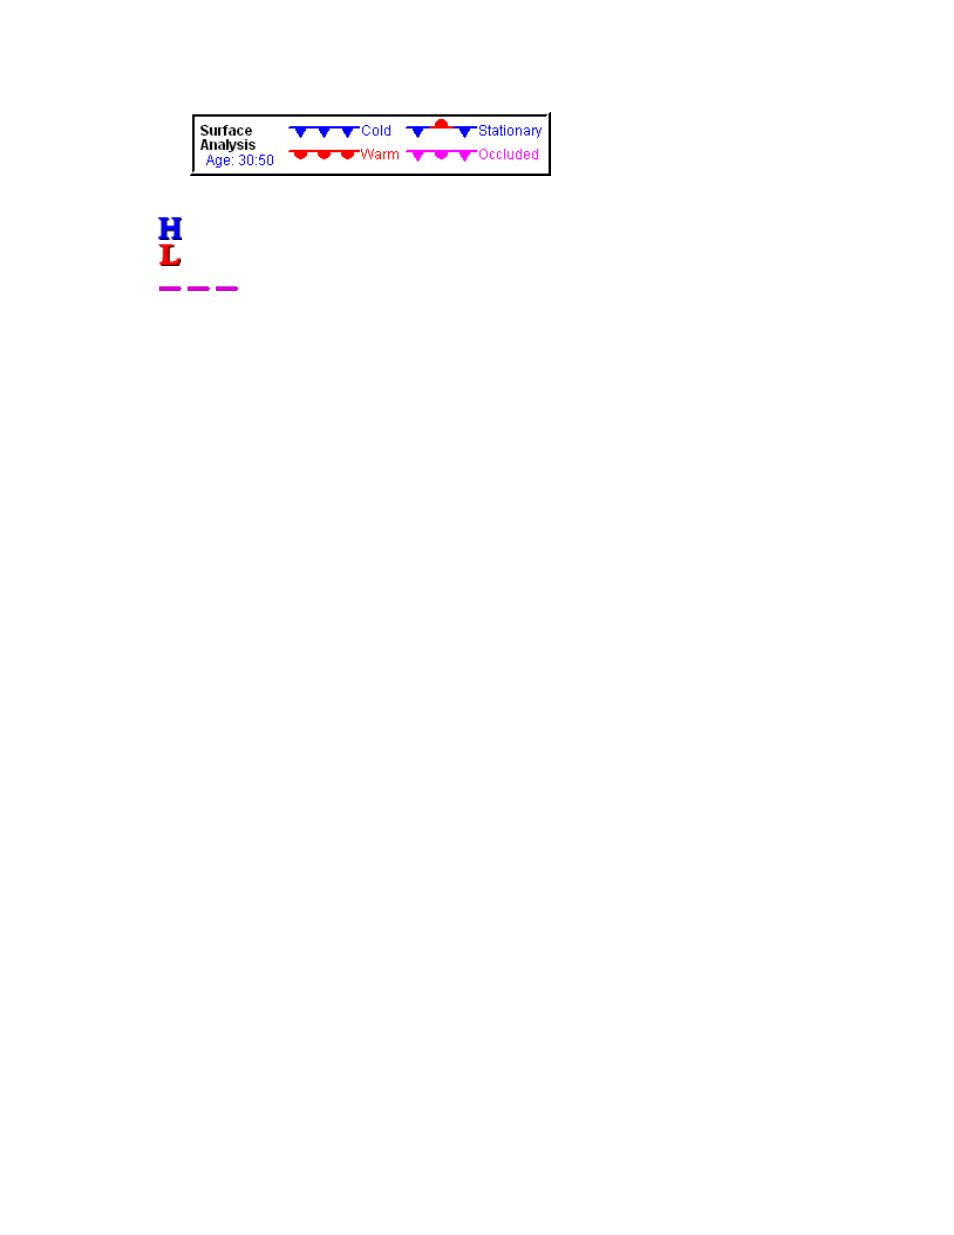
Additional symbols seen not indicated on the legend in the application are as follows:
High Pressure Center
Low Pressure Center
Trough
Freezing Levels
Freezing level height contours for the highest freezing level drawn at 2,000 foot
intervals above mean sea level.
Freezing Level Overlay
To view freezing levels on all the chart components:
1. Click the Chart Setup tab.
2. Click Weather Options.
3. Select the Freezing Levels check box.
4. Click on a page tab you wish to view freezing levels.
5. Click the Wx button to display and hide weather.
Freezing levels appear on all the enroute chart views when the view is at
approximately 600 nautical miles per square inch. It also appears over any selected
geo-referenced terminal chart displayed in the Terminal page.