Chart tracking mode, Chart orientation, S, see – Jeppesen FliteDeck 3 User Manual
Page 176
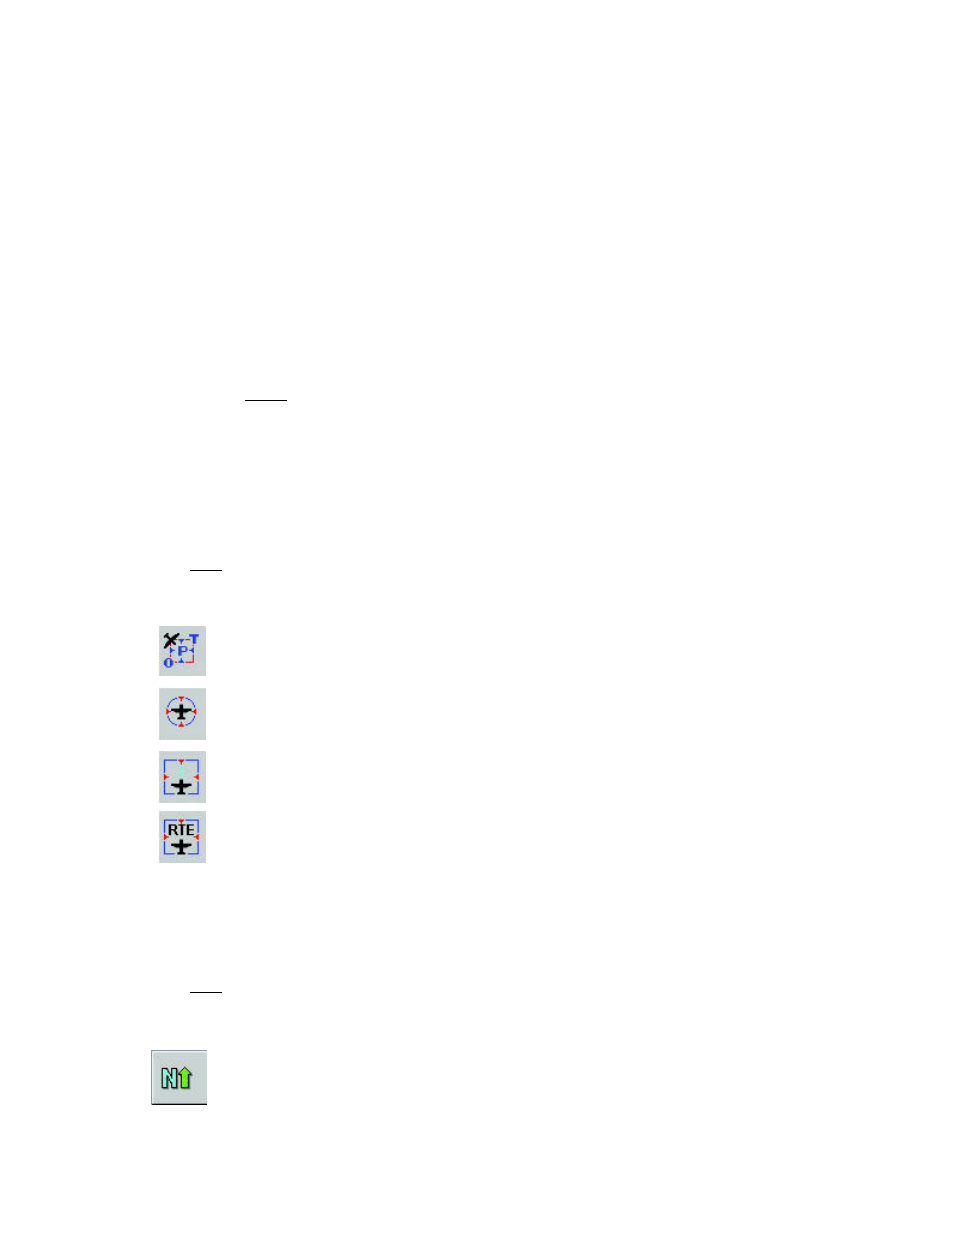
Chart Setup page
179
•
Aviation Routine Weather Reports (METARs)
•
Temporary Flight Restrictions (TFRs)
•
Terminal Area Forecasts (TAFs)
•
•
•
•
•
Unlike the other
, weather products do not have a decluttering
mechanism to help manage chart elements. Once the products are turned on, they
display at all zoom levels up to continental. Most weather products begin to display
when the view is set at approximately 600 nautical miles per square inch. METARs
display when the view is at 500 nautical miles per square inch. For additional
information, see
To return to the enroute chart preferences, click Chart Options.
Chart Tracking Mode
When GPS position information is available, the Chart Tracking mode adjusts the
enroute chart according to your aircraft position. Clicking the Chart Track button
cycles between four settings:
Optimum mode shows the maximum amount of chart area ahead of
the aircraft symbol, moving the chart beneath it along the planned
route.
Centered mode centers your aircraft in the screen and moves the
chart beneath it.
Visible mode moves your aircraft icon across the chart view. This
mode requires the least CPU performance because the chart moves
only when the aircraft flies off the edge.
Route mode zooms out to show the full route.
When you click one of these buttons, the status bar indicates which tracking mode
you have switched to.
Chart Orientation
When GPS position information is available, the chart can be rotated, the way some
people like to hold paper charts. Clicking the Chart Orientation button cycles
between three options:
North Up keeps the top of the chart at the top of the screen and true
north, like a standard paper chart.