Surface analysis overlay, Legend and age of data – Jeppesen FliteDeck 3 User Manual
Page 227
JeppView FliteDeck User's Guide
230
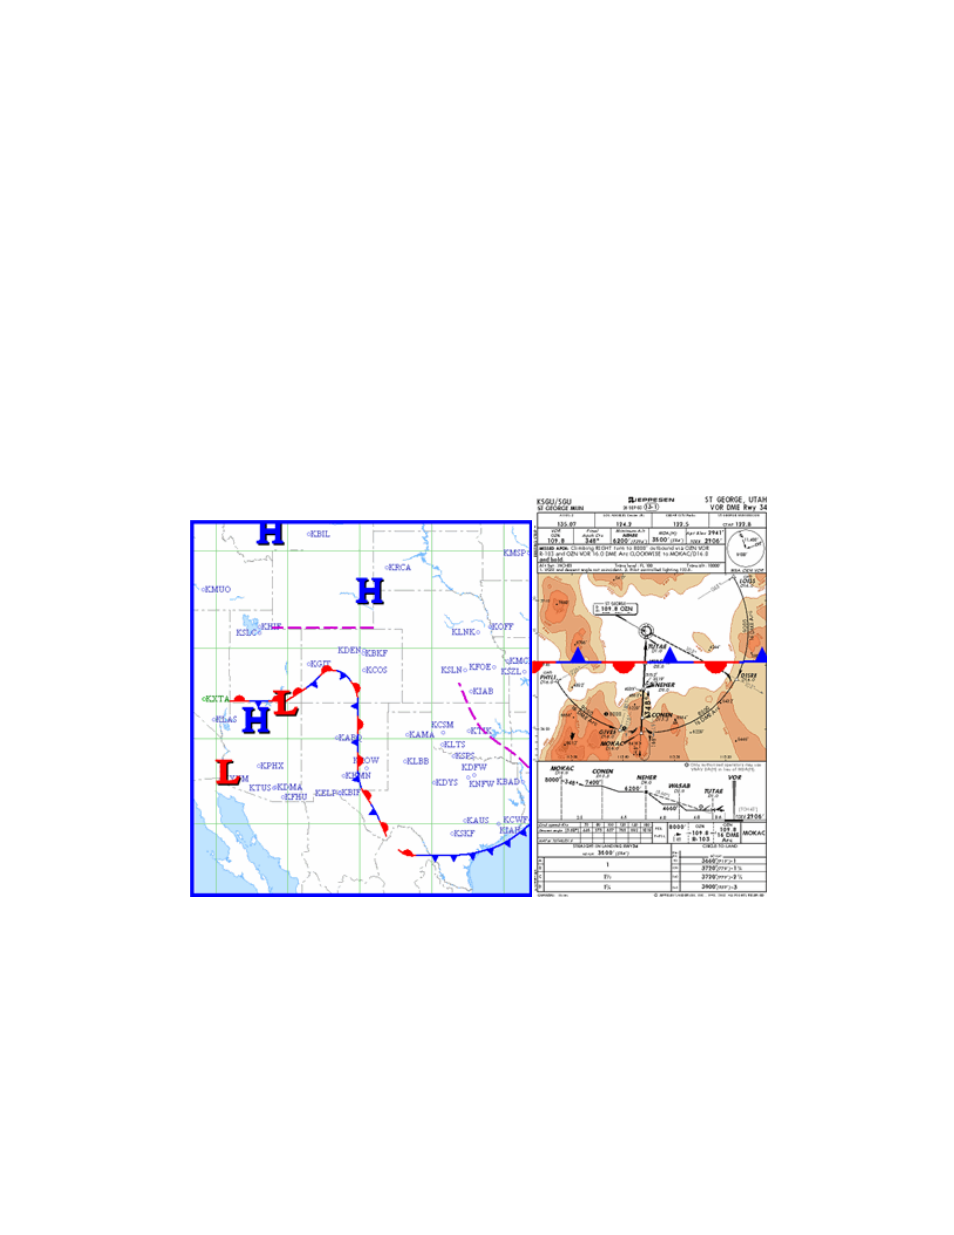
The surface analysis depicts current conditions of surface fronts, as well as high and
low pressure centers. The pressure is measured at the center of the system in
millibar units; cold and warm fronts are indicated along with the front’s direction of
movement.
Surface Analysis Overlay
To view the surface analysis on all the chart components:
1. Click the Chart Setup tab.
2. Click Weather Options.
3. Select the Surface Analysis check box.
4. Click on a page tab you wish to view weather.
5. Click the Wx button to display and hide weather.
Surface analysis appears over all the enroute chart views when the view is at
approximately 600 nautical miles per square inch. It also appears over any selected
geo-referenced terminal chart displayed in the Terminal page.
Legend and Age of Data
To view the age of the data, click Wx on any of the pages (except the Text page and
the Terminal page does not display legend information) until the Surface Analysis
legend appears (see
for additional information). On the legend
there is a counter displaying the age of the data.
Data Broadcast Frequency: 12 minutes