4 viewing constituent data, 5 constituent data display precision, Viewing constituent data – Metrohm Vision Manual User Manual
Page 34: Constituent data display precision
32
▪▪▪▪▪▪▪
3.4.4
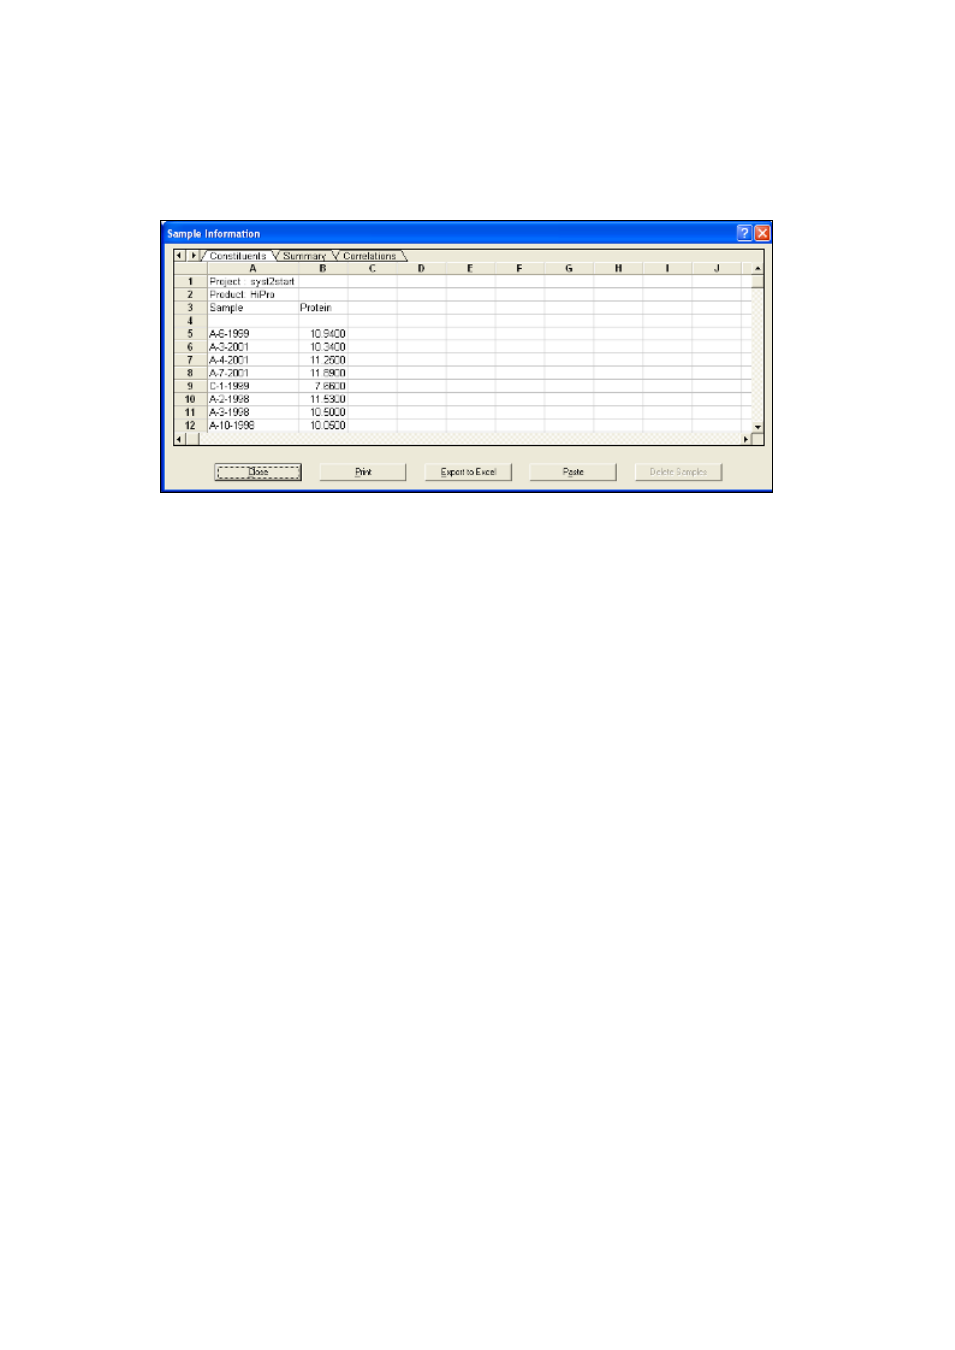
Viewing Constituent Data
In order to view constituent data, click on a product or sample spectrum to highlight it. Click on
Edit/Constituent Values. A spreadsheet with constituent data will be displayed.
The data can be printed or the whole spreadsheet exported to Excel.
•
Click on tab Constituents to display the constituent values for all constituents.
•
Click on tab Summary to display the statistics for all constituents: maximum value, minimum
value, mean, and standard deviation.
•
Click on the "Correlations" tab to display intercorrelations between constituents.
3.4.5
Constituent Data Display Precision
The number of digits after the decimal point can be changed. The change will affect all spreadsheets
where constituent data or predicted values are listed, including Routine Analysis Report.
To change the constituent data display precision:
•
In Data Acquisition mode click on Edit/Products.
•
Select Constituents radio button and click on Edit.
•
Enter the number of digits in the Decimal Points field and press Enter key. The precision is
defined for each constituent separately.