3 running routine analysis, 1 routine analysis procedure, Running routine analysis – Metrohm Vision Manual User Manual
Page 181: Routine analysis procedure
▪▪▪▪▪▪▪
179
6.3
Running Routine Analysis
Once the Operations Method is configured properly, you can run Routine Analysis to analyze samples
in real time. Vision will automatically open the Routine Analysis output project. If data acquisition
timer has been configured, Vision will start to acquire sample spectra automatically.
6.3.1
Routine Analysis Procedure
1.
Click on Mode/Routine Analysis/Run Routine Analysis to start the program.
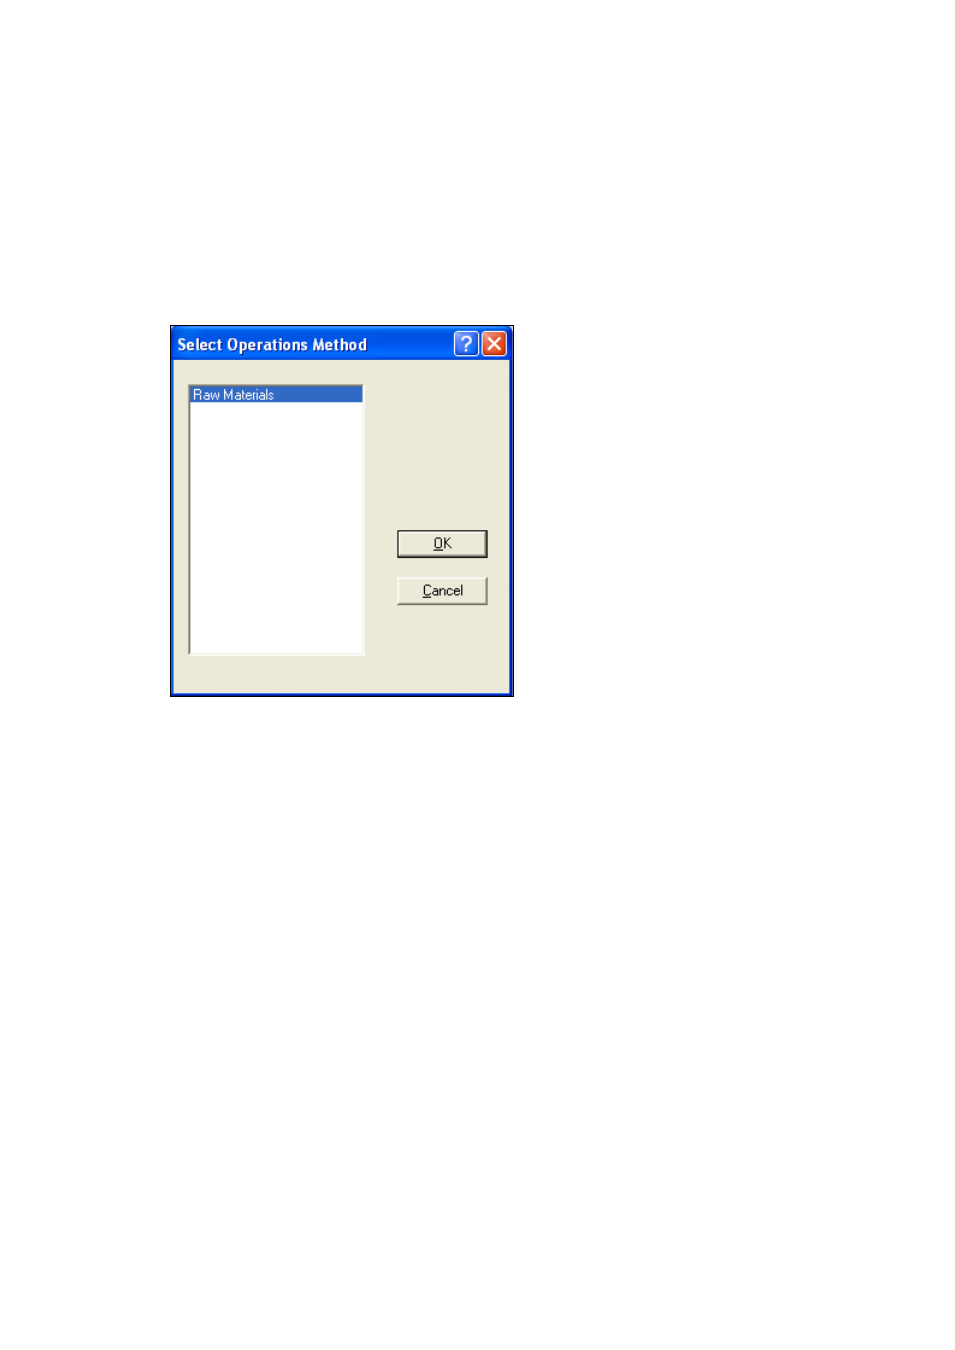
2.
From the Select Operations Method dialog box choose the Operations Method.
3.
If the data acquisition timer is not set up, click on the reference icon to collect the reference
spectrum, and then on the spectrum icon.
4.
The Enter Sample Information dialog box shows up. Enter the necessary information into the
box:
•
From the Product ID drop-down list choose the Unknown or the product name.
•
Click on OK when done.
5.
The X and Y axes can be manually configured on trend charts and control charts. To configure
axes click on the configuration icon next to the appropriate graph.
6.
Vision will start the data collection. After the spectrum is acquired, Vision will perform the
analysis and display the results.
7.
Click on Mode/Routine Analysis/Run Routine Analysis and unselect it to quit Routine Analysis.
During spectral acquisition click on the Stop icon first.
You can print the results of Routine Analysis at any time by clicking on File/Print. Make sure that the
results view is the active window.
Comments entered into Sample Information window are transferred to the report spreadsheet and
displayed in Details sheet. If a number is entered instead of comment, it can be used in the report
spreadsheet for results post-processing. This requires report modification.