3 trend analysis, Trend analysis – Metrohm Vision Manual User Manual
Page 140
138
▪▪▪▪▪▪▪
The equation parameters, statistics, and graphs are recalculated and views updated.
To move spectra between calibration, validation, and outlier sets, right click on a dot representing a
spectrum in any plot or the spectrum name in the equation tree. The equation parameters, statistics,
and graphs are recalculated and views updated.
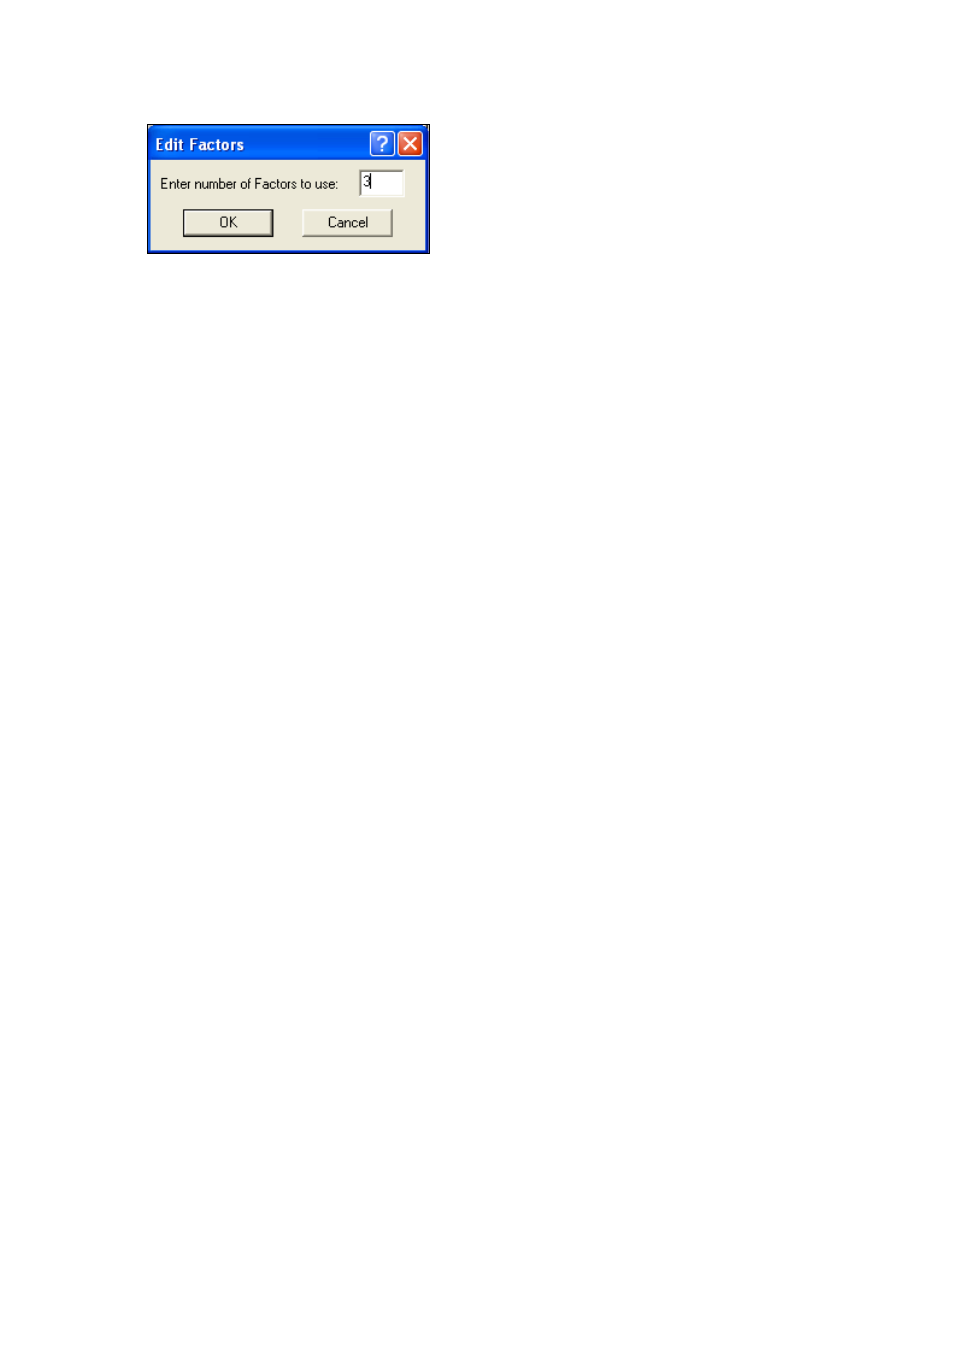
To display a different number of loadings and weights, click on the factor number on the spreadsheet
with equation parameters (i.e., summary tab).
To save the equation, click on Regression/Save Equation. To save the equation under a different
name, click on Regression/Save Equation As.
5.4.3
Trend Analysis
Trend Analysis is located in the Regression part of Vision. However, no lab data are necessary to
perform trend analysis. Trend analysis has been designed to look at the trend of spectral values at
selected parts of spectra, and judge the progress of a reaction based on the trend direction and
magnitude.
The trend function is calculated over a defined wavelength range and can be defined in several ways:
•
As an average spectral value over the range
•
As the highest or lowest spectral value within the range
•
As an integral of spectral values within the range
•
As standard deviation of spectral values within the range
The spectral values can be simply absorbance, or any combination of available math pretreatments
can be used. The chosen pretreatment type is global to all selected ranges.
Up to 8 wavelength ranges can be used, and each can have a uniquely calculated trend magnitude.
Trend magnitudes from multiple regions can be combined in the final expression, using basic
mathematical operations.
A range can contain only one data point. In this particular case, trend analysis allows the user to
create a custom equation with up to 8 wavelengths, with manually entered constants.
To create an equation for trend analysis:
1.
Perform the standard quantitative sample selection.
2.
Click on Mode/Quantitative Analysis/Regression.
3.
Select the equation and click on Regression/Edit Regression Method.