2 viewing best matches, 4 analyzing stored data, Viewing best matches – Metrohm Vision Manual User Manual
Page 182: Analyzing stored data
180
▪▪▪▪▪▪▪
6.3.2
Viewing Best Matches
Up to 10 best qualitative matches can be displayed in Routine Analysis. To view best matches, click
on the “10 best matches” icon (leftmost icon on the toolbar). When clicked, Vision displays a window
with up to 10 library products arranged according to decreasing similarity to analyzed sample,
together with match values. This feature uses library identification function to create the list of best
matches.
6.4
Analyzing Stored Data
Vision allows for analysis of spectra stored in a project using an appropriate Operations Method.
Stored Spectra Analysis Procedure
1.
Click on Mode/Routine Analysis/Analyze Stored Data to start the program.
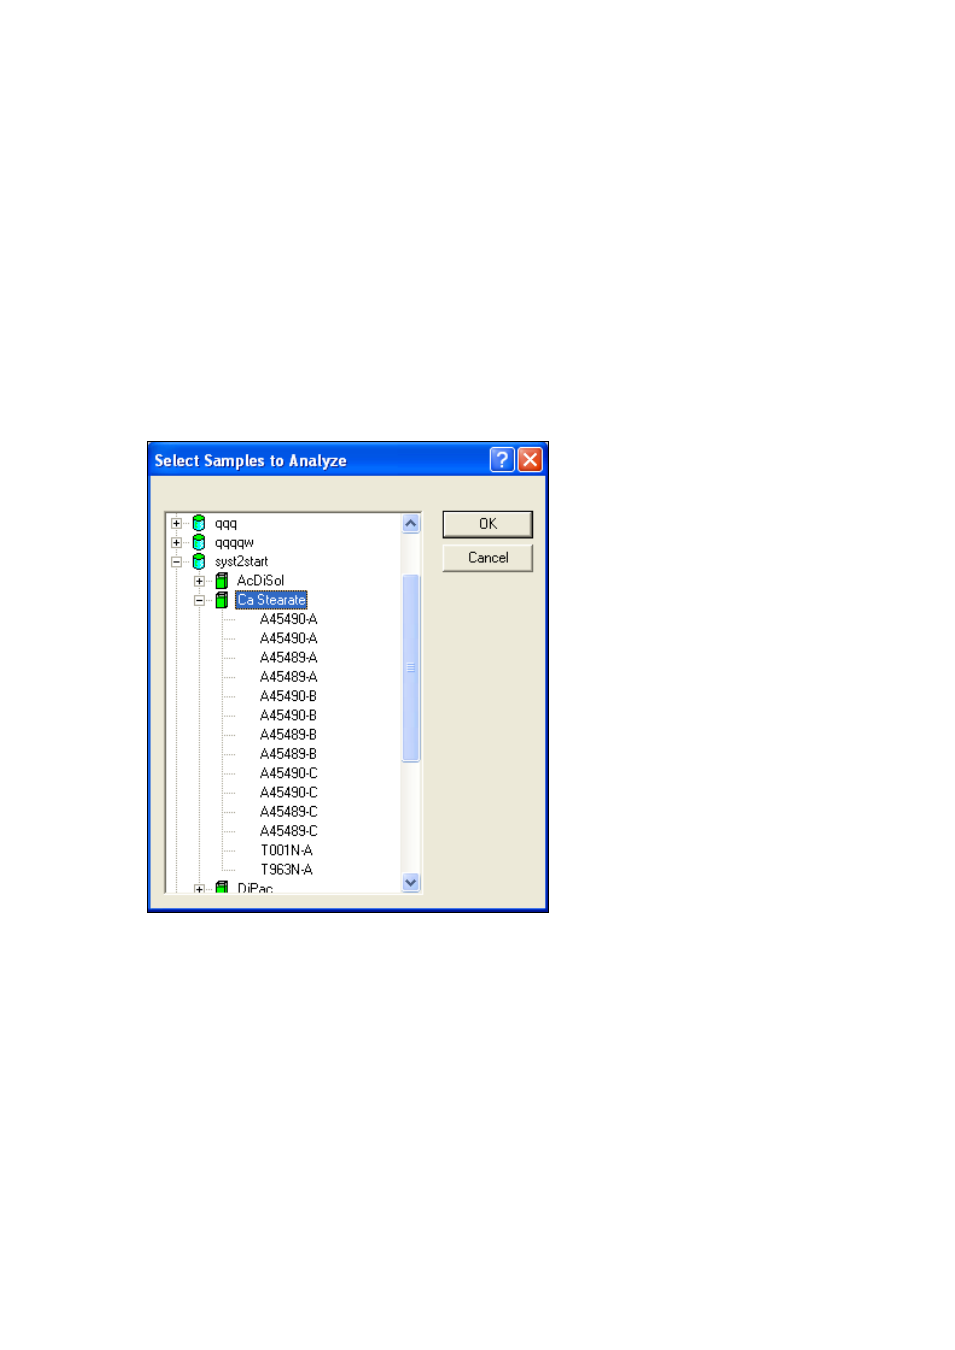
2.
From the Select Samples to Analyze dialog box expand the project and product from which
you want to analyze spectra. Select spectra by clicking on them. Click on OK when done.
- 915 KF Ti-Touch (382 pages)
- 800 Dosino (53 pages)
- 767 Calibrated Reference (23 pages)
- 940 Professional IC Vario ONE/SeS/Prep 2 (54 pages)
- 754 Dialysis Unit (49 pages)
- 815 Robotic Soliprep for LC (76 pages)
- tiamo 2.1 Manual (1532 pages)
- 825 Lab Link (37 pages)
- 808 Titrando (70 pages)
- 902 Titrando (52 pages)
- 756 KF Coulometer (163 pages)
- 756 KF Coulometer (162 pages)
- 940 Professional IC Vario ONE/LPG (98 pages)
- 850 Professional IC Anion MCS Prep 3 (154 pages)
- 850 Professional IC Anion MCS Prep 3 (152 pages)
- 904 Titrando (58 pages)
- 850 Professional IC Anion MSM-HC MCS Prep 2 (150 pages)
- 930 Compact IC Flex Oven/ChS/Deg (47 pages)
- 872 Extension Module Liquid handling (64 pages)
- 814 USB Sample Processor (90 pages)
- 814 USB Sample Processor (91 pages)
- 940 Professional IC Vario (43 pages)
- Vision – Tutorial (40 pages)
- 799 GPT Titrino (242 pages)
- 889 IC Sample Center (68 pages)
- 761 Compact IC (228 pages)
- 851 Titrando (100 pages)
- 748 DH Sample Changer (32 pages)
- 940 Professional IC Vario ONE/SeS/HPG (51 pages)
- 896 Professional Detector – Amperometry (62 pages)
- 877 Titrino plus (139 pages)
- 881 Compact IC pro – Anion (129 pages)
- 940 Professional IC Vario ONE/ChS/HPG (112 pages)
- 930 Compact IC Flex Deg (41 pages)
- 840 PC Control 5.0 / Touch Control (351 pages)
- 940 Professional IC Vario ONE/Prep 1 (45 pages)
- 776 Dosimat (42 pages)
- 717 Sample Changer (36 pages)
- 815 Robotic USB Sample Processor XL (113 pages)
- 815 Robotic USB Sample Processor XL (114 pages)
- 940 Professional IC Vario ONE/SeS/PP (126 pages)
- 838 Advanced Sample Processor Installation Instructions (109 pages)
- 700 Dosino (55 pages)
- 719 S Titrino (152 pages)