Metrohm Vision Manual User Manual
Page 107
▪▪▪▪▪▪▪
105
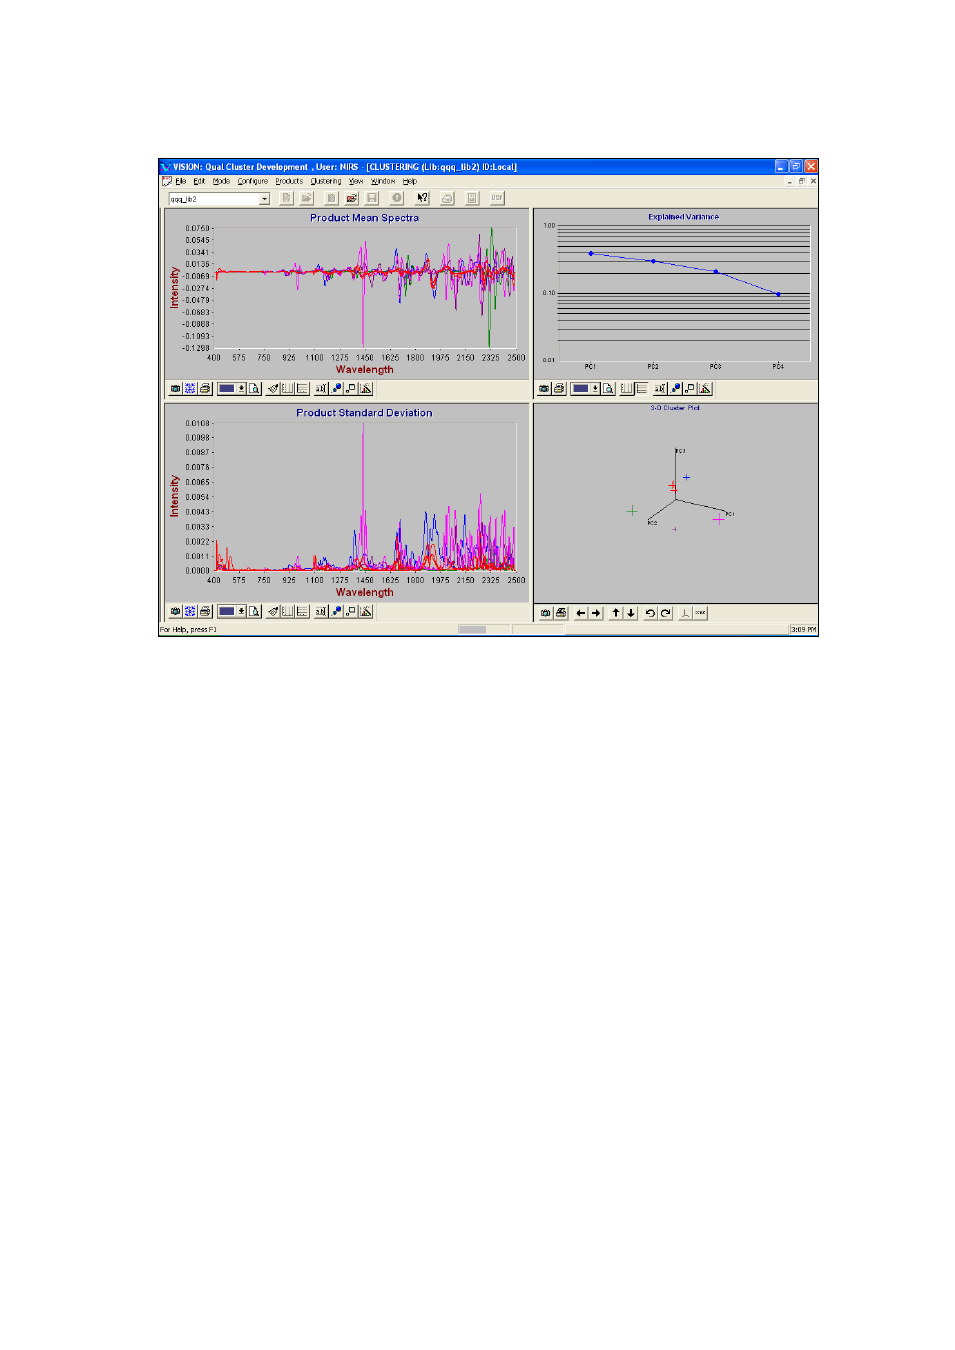
The results screen displays.
The left hand side of the screen contains the cluster tree, showing the library structure.
The right side of the screen contains four panels with product mean spectra, product standard
deviation spectra, cumulative variance plot, and 3D plot displaying the PC library model.
Initially, the 3D plot displays all library products (in case a library cannot be clustered, the plot is
empty). Products from different clusters are displayed in different colors. You can identify a product
by double-clicking on the cross representing the product.
If the library clustering model contains several cluster levels, you can display a lower level cluster by
double clicking on it in the library tree. Double clicking on the lowest level cluster will switch Vision to
local ID development only if the local ID method was set up.
Editing the Local Identification Method
Once the cluster local identification method has been created, it can be replaced by a different
method or its parameters edited.
1.
If necessary, enter the Library Clustering program and create a clustering method with the
Setup Identify Method box checked. You can also open a library with a clustering method and
local identification methods already created.
2.
Expand the cluster tree. Double click on the leaf cluster for which you want to edit the
method.
3.
Vision will switch to the local Identification method development.