5 viewing equation properties, 1 calibration equation sets, Viewing equation properties – Metrohm Vision Manual User Manual
Page 142: Calibration equation sets
140
▪▪▪▪▪▪▪
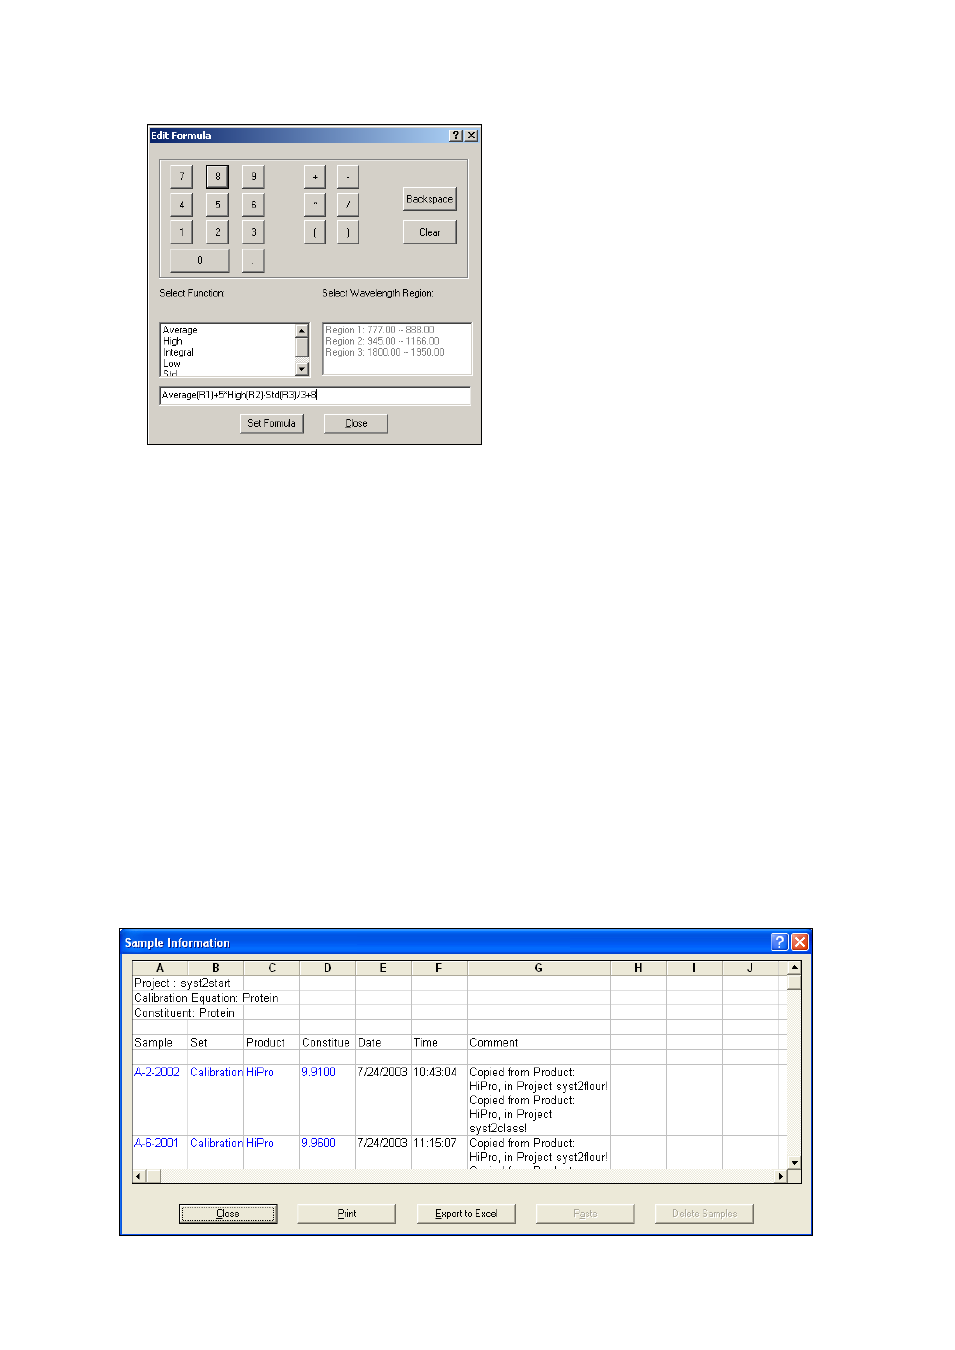
This dialog defines functions used on each range, and the overall formula combining the functions.
To create a formula, click on the function, then on the desired region. Add another segment to the
formula using provided operands and constants. The created formula is listed below functions and
ranges.
To apply the formula on the calibration spectra:
1.
Click on Set Formula and then on Close. The plot shows the trend resulting from the created
formula applied on the calibration spectra.
2.
Click on the blue “Save” icon to save the formula. The created formula can be used in
Routine Analysis and the results displayed on a Trend Chart.
5.5
Viewing Equation Properties
The calibration equation sample sets and equation properties can be displayed and inspected
5.5.1
Calibration Equation Sets
In order to view sample sets used for calibration equation development, enter the Quant Sample
Selection program. Select the product and constituent. All calibration equations for the selected
product and constituent will be displayed. Highlight the chosen equation and click on Edit/Properties.