KYORITSU 6315 Instruction Manual User Manual
Page 111
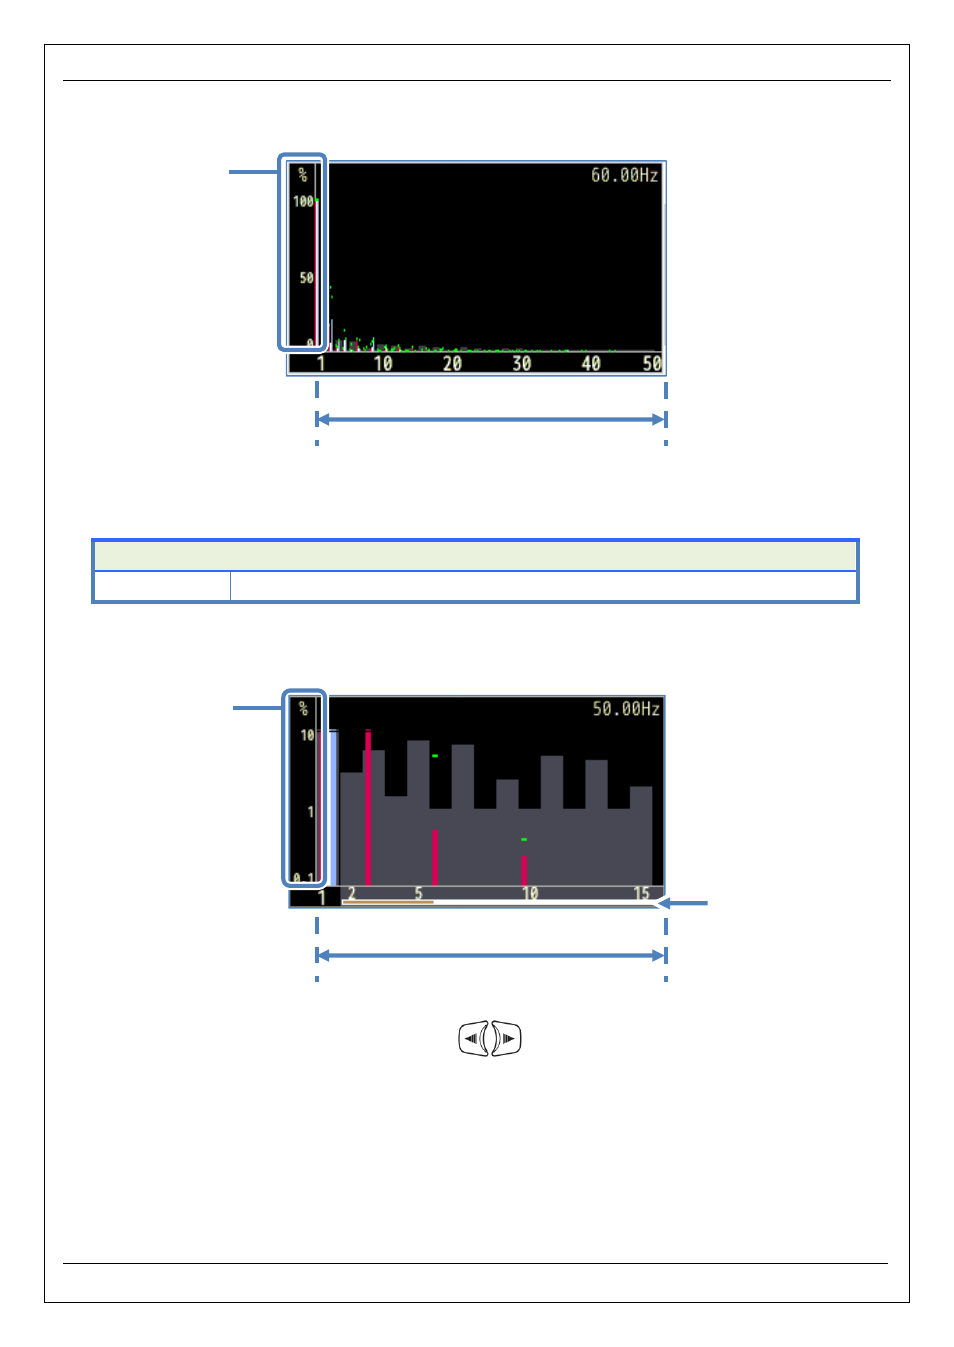
Displaying harmonics on the bar graph
-
Bar graph display
e.g.) “Linearity” is displayed in “Full-scale”.
In the above example, “Linear” and “full-scale” are selected. In this case, the upper limit of the rate of
content is “100%” and all harmonics, 1
st
to 50
th
, are displayed
e.g.) The following represents 3P4W (Three-phase 4
When selecting “LOG” (Logarithm), 10% will be the max percentage of the vertical axis and the
displayed are limited up to 15
th
order. Press the
of 1
st
order is fixed and does not move. The white bar
orange bar shows the percentage of the present displayed
Item displayed on the LCD
Rate of content
Harmonic content of each order
Harmonics analysis: up to 50
Rate of content
Rate of content
Harmonics analysis:
KEW6315
109 -
KEW6315
are selected. In this case, the upper limit of the rate of
, are displayed on one screen.
phase 4-wire) while “LOG” and “Zoom” are selected.
, 10% will be the max percentage of the vertical axis and the harmonics
key to scroll the pages. The basic waveform
hite bar shows the percentage of hidden pages and the dark
ercentage of the present displayed page.
displayed on the LCD
of each order against the 1st basic wave.
Harmonics analysis: up to 50
th
order
Harmonics analysis: displayed up to 15
th
order
Scroll bar