Profile graphic – Printronix PrintNet Enterprise User Manual
Page 109

Profiler View
109
Profile Graphic
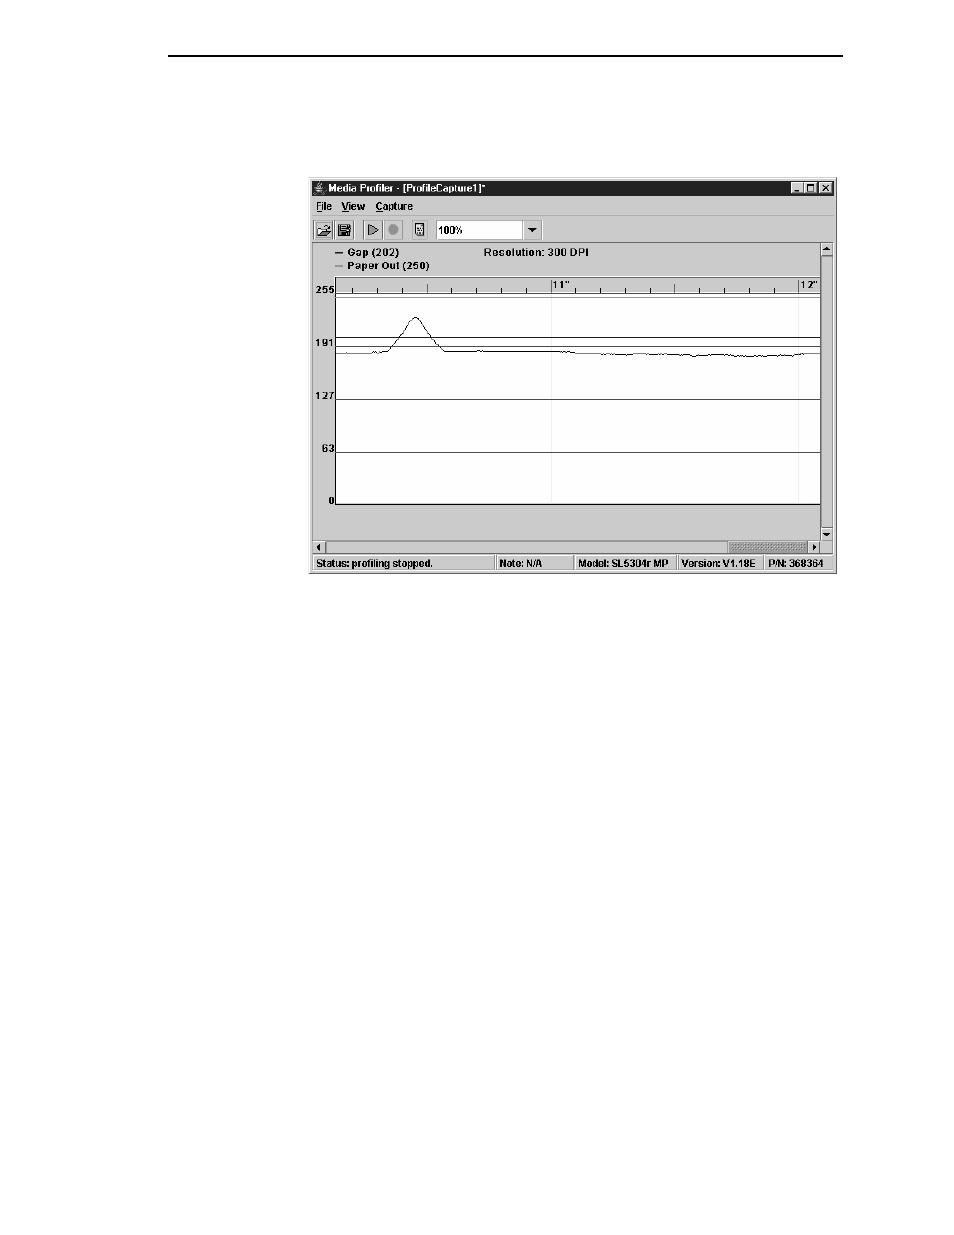
Figure 88. Profiler Graphic
The profile graphic has four horizontal divider lines to indicate the quarter
values of the sample data. When the capture starts, the samples of the
profiler data will display on the graph.
The printer will send out the profiler sample data on regular intervals and the
profiler view will be updated automatically. If the profiler graph is too wide to
be shown in one window, a scroll bar will appear to be able to scroll the graph.
The printer sends out one sample for each dot, so 300 samples per inch will
be received for a 300 DPI printer. During the capture, the view will auto scroll
to show the last captured profiler data until the specified time has elapsed or
you stop the capture. See Figure 88.
When the profiler test starts, the printer will send out the current threshold
values. The thresholds are indicated by colored horizontal lines on the profiler
graphic: blue for the Sensor Type threshold and green for the Paper Out
threshold. If dynamic sensing is enabled on the printer, the Sensor Type
threshold will be shown dynamically similar to the sample data.
