2 status: packet statistics, Figure 9 status > packet statistics, Table 4 status > packet statistics – ZyXEL Communications G.SHDSL.bis 4-port Security Gateway P-793H User Manual
Page 53
P-793H User’s Guide
Chapter 2 Introducing the Web Configurator
53
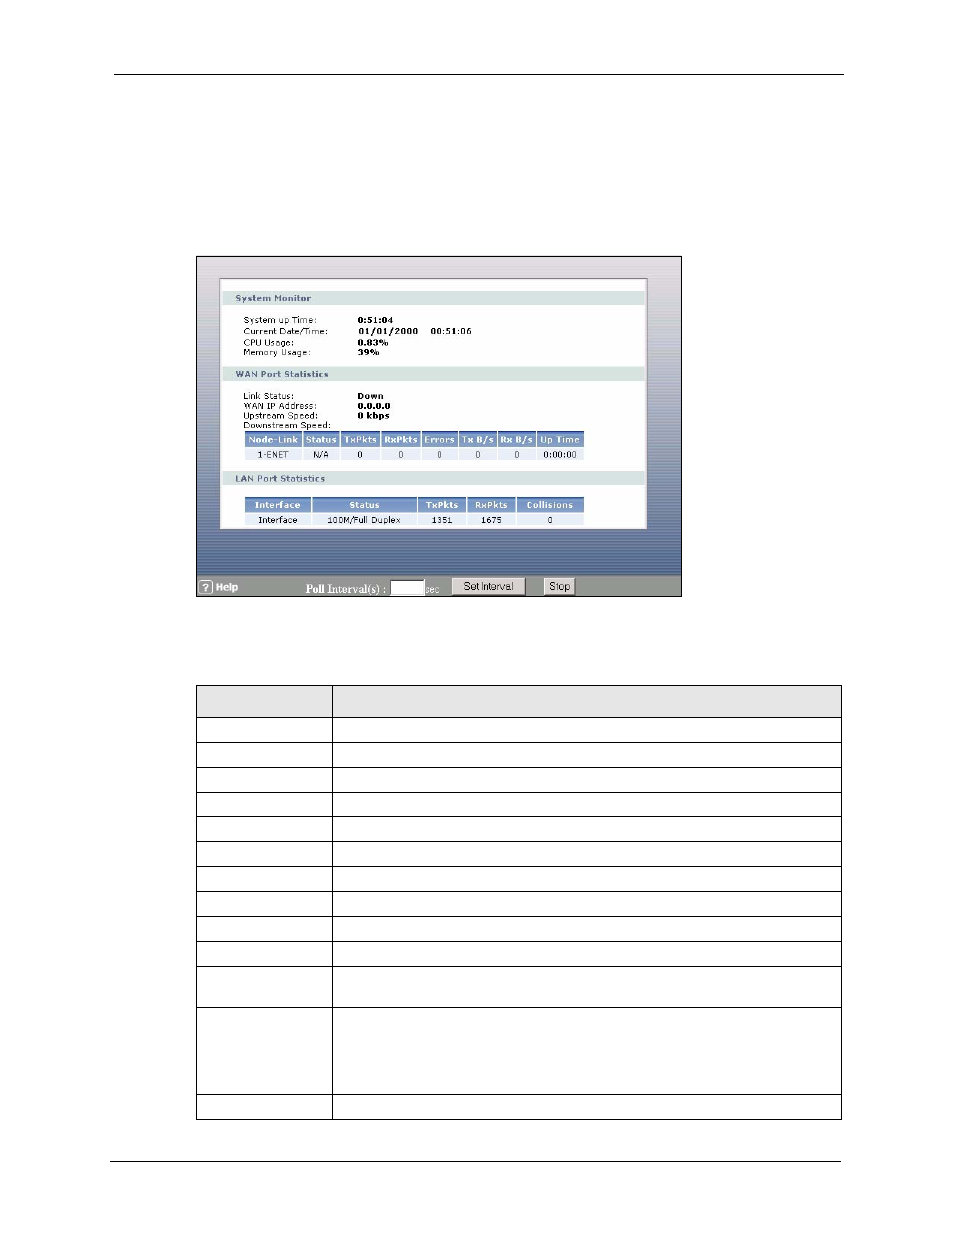
2.4.2 Status: Packet Statistics
Click the Packet Statistics hyperlink in the Status screen. Read-only information here
includes port status and packet specific statistics. Also provided are "system up time" and "poll
interval(s)". The Poll Interval(s) field is configurable.
Figure 9 Status > Packet Statistics
The following table describes the fields in this screen.
Table 4 Status > Packet Statistics
LABEL
DESCRIPTION
System Monitor
System up Time
This is the elapsed time the system has been up.
Current Date/Time
This field displays your ZyXEL Device’s present
date and time.
CPU Usage
This field specifies the percentage of CPU utilization.
Memory Usage
This field specifies the percentage of memory utilization.
WAN Port Statistics
Link Status
This is the status of your WAN link.
WAN IP Address
This is the IP address assigned to your ZyXEL Device on the WAN.
Upstream Speed
This is the upstream speed of your ZyXEL Device.
Downstream Speed This is the downstream speed of your ZyXEL Device.
Node-Link
This field displays the remote node index number and link type. Link types are
PPPoA, ENET, RFC 1483 and PPPoE.
Status
This field displays Down (line is down), Up (line is up or connected) if you're
using Ethernet encapsulation and Down (line is down), Up (line is up or
connected), Idle (line (ppp) idle), Dial (starting to trigger a call) and Drop
(dropping a call) if you're using PPPoE encapsulation. It displays N/A if the port is
not connected.
TxPkts
This field displays the number of packets transmitted on this port.