Utilization summary – Dell POWEREDGE M1000E User Manual
Page 431

Viewing Statistics and Remote Monitoring
429
Utilization Summary
Use the
Utilization Summary
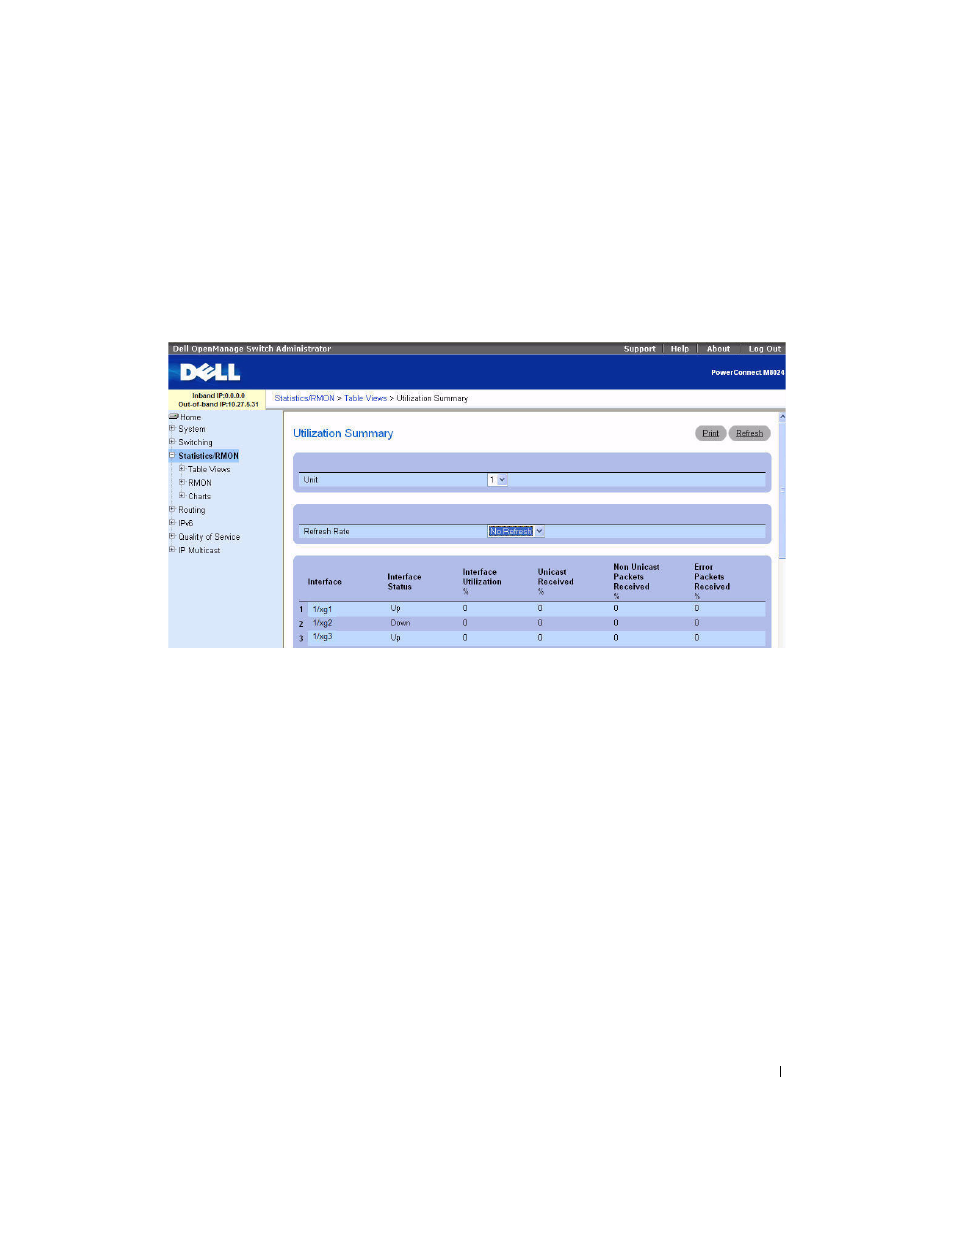
page to display interface utilization statistics.
To display the page, click Statistics/RMON > Table Views > Utilization Summary in the tree view.
Figure 8-5. Utilization Summary
The Utilization Summary page contains the following fields:
• Unit — Specifies the unit for which statistics are displayed.
•
Refresh Rate — Specifies amount of time that passes before statistics are refreshed. The possible field
values are No Refresh, 15, 30, and 60 seconds. Default is No Refresh.
•
Interface — Specifies the interface for which statistics are displayed.
• Interface Status — Displays status of the interface.
• Interface Utilization % — Displays network interface utilization percentage based on the duplex
mode of the interface. The range of this reading is from 0 to 200%. The maximum reading of 200% for
a full duplex connection indicates that 100% of bandwidth of incoming and outgoing connections is
used by the traffic travelling through the interface. The maximum reading for a half duplex connection
is 100%.
•
Unicast Received % — Displays percentage of Unicast packets received on the interface.
• Non Unicast Packets Received % — Displays percentage of non-Unicast packets received on the
interface.
•
Error Packets Received % — Displays number packets with errors received on the interface.
