HP Insight Control Software for Linux User Manual
Page 163

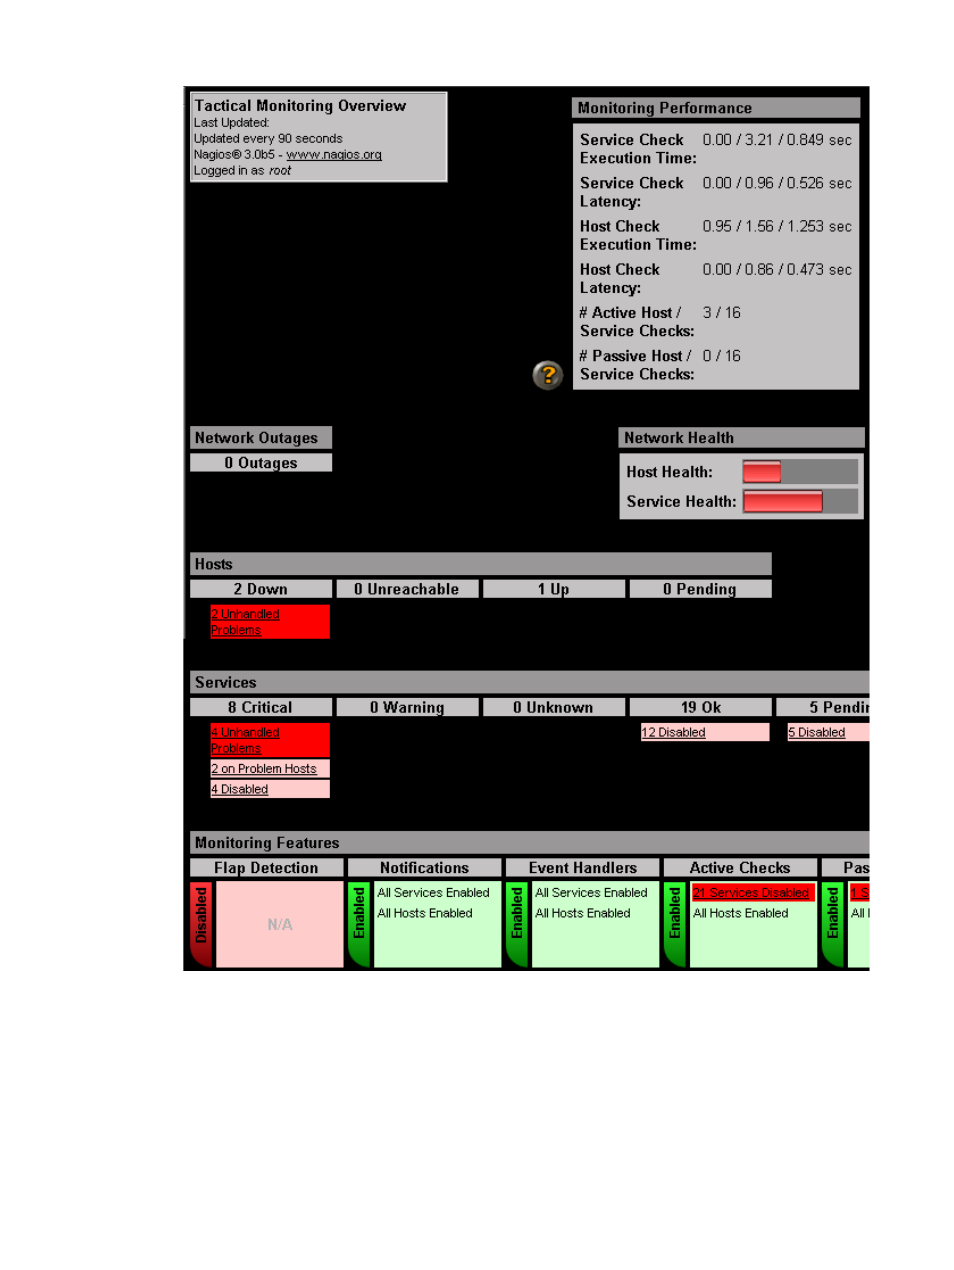
Figure 25 Nagios tactical overview
The top of the window provides information about the network. It provides the number of network
outages and information on the network health in terms of the Nagios hosts and Nagios services.
The next portion of the window contains information about the Nagios hosts. It reports the number
of hosts that are down, unreachable, up, and pending.
In
, two hosts are down. Select the link in that box to open the Host Status Details window
for that host, which identifies the hosts and provides status information about them.
The standard Nagios Tactical Overview display uses the color red to highlight ‘Disabled’ services.
To illustrate, in
, in the Active Checks column, the message 21 Services Disabled
is displayed on a red field.
20.3 Using Nagios 163
- Scripting Toolkit for Linux (68 pages)
- Scripting Toolkit for Windows 9.50 (62 pages)
- Scripting Toolkit for Windows 9.60 (62 pages)
- Storage Area Manager (13 pages)
- Core HP-UX (5 pages)
- Matrix Operating Environment Software (232 pages)
- Matrix Operating Environment Software (70 pages)
- Matrix Operating Environment Software (120 pages)
- Matrix Operating Environment Software (36 pages)
- Matrix Operating Environment Software (99 pages)
- Matrix Operating Environment Software (192 pages)
- Matrix Operating Environment Software (198 pages)
- Matrix Operating Environment Software (66 pages)
- Matrix Operating Environment Software (152 pages)
- Matrix Operating Environment Software (95 pages)
- Matrix Operating Environment Software (264 pages)
- Matrix Operating Environment Software (138 pages)
- Matrix Operating Environment Software (137 pages)
- Matrix Operating Environment Software (97 pages)
- Matrix Operating Environment Software (33 pages)
- Matrix Operating Environment Software (189 pages)
- Matrix Operating Environment Software (142 pages)
- Matrix Operating Environment Software (58 pages)
- Matrix Operating Environment Software (68 pages)
- Matrix Operating Environment Software (79 pages)
- Matrix Operating Environment Software (223 pages)
- Matrix Operating Environment Software (136 pages)
- Matrix Operating Environment Software (63 pages)
- Matrix Operating Environment Software (34 pages)
- Matrix Operating Environment Software (67 pages)
- Matrix Operating Environment Software (128 pages)
- Matrix Operating Environment Software (104 pages)
- Matrix Operating Environment Software (75 pages)
- Matrix Operating Environment Software (245 pages)
- Matrix Operating Environment Software (209 pages)
- Matrix Operating Environment Software (71 pages)
- Matrix Operating Environment Software (239 pages)
- Matrix Operating Environment Software (107 pages)
- Matrix Operating Environment Software (77 pages)
- Insight Management-Software (148 pages)
- Matrix Operating Environment Software (80 pages)
- Insight Management-Software (128 pages)
- Matrix Operating Environment Software (132 pages)
- Matrix Operating Environment Software (74 pages)
- Matrix Operating Environment Software (76 pages)
