Nematron Pointe Controller User Manual
Page 211
Pointe Controller User Guide
Chapter 7: Monitoring and Debugging
209
block is executed, and the information can be displayed either as a visible path in
the debugger window (Show Debug Trace) or as tabular data (View Debug
Trace).
Up to 1000 steps (records) can be saved in a circular memory buffer; if more than
1000 steps are recorded, the trace overwrites from the beginning of the buffer.
The buffer is reset for each new scan of the chart.
NOTE: Enabling Debug Trace adversely affects the execution speed of the Pointe
Controller unit. As such, Debug Trace is automatically disabled when the
debugger window is closed.
Show Debug Trace
Once debug tracing is enabled, you can select the Show Debug Trace tool
to display the tracing in the debugger window. In Flow Charts, the trace is
displayed as a yellow frame around the currently active block. In Ladder
Diagrams, the trace is displayed as a green highlight along the currently active
rung.
Show Debug Trace is automatically enabled when the Enable Debug Trace tool is
selected.
NOTE: In Ladder Diagrams, the trace display and trace record collections are
interlocked so that a whole pass through the diagram is shown. That is, the
display of the trace will be done only after the last ladder object in the last rung
of the diagram executes, but before the trace buffer is reinitialized at the top of
the diagram. This differs from the tracing done in the Flow Charts, in which
partial passes through a chart are shown.
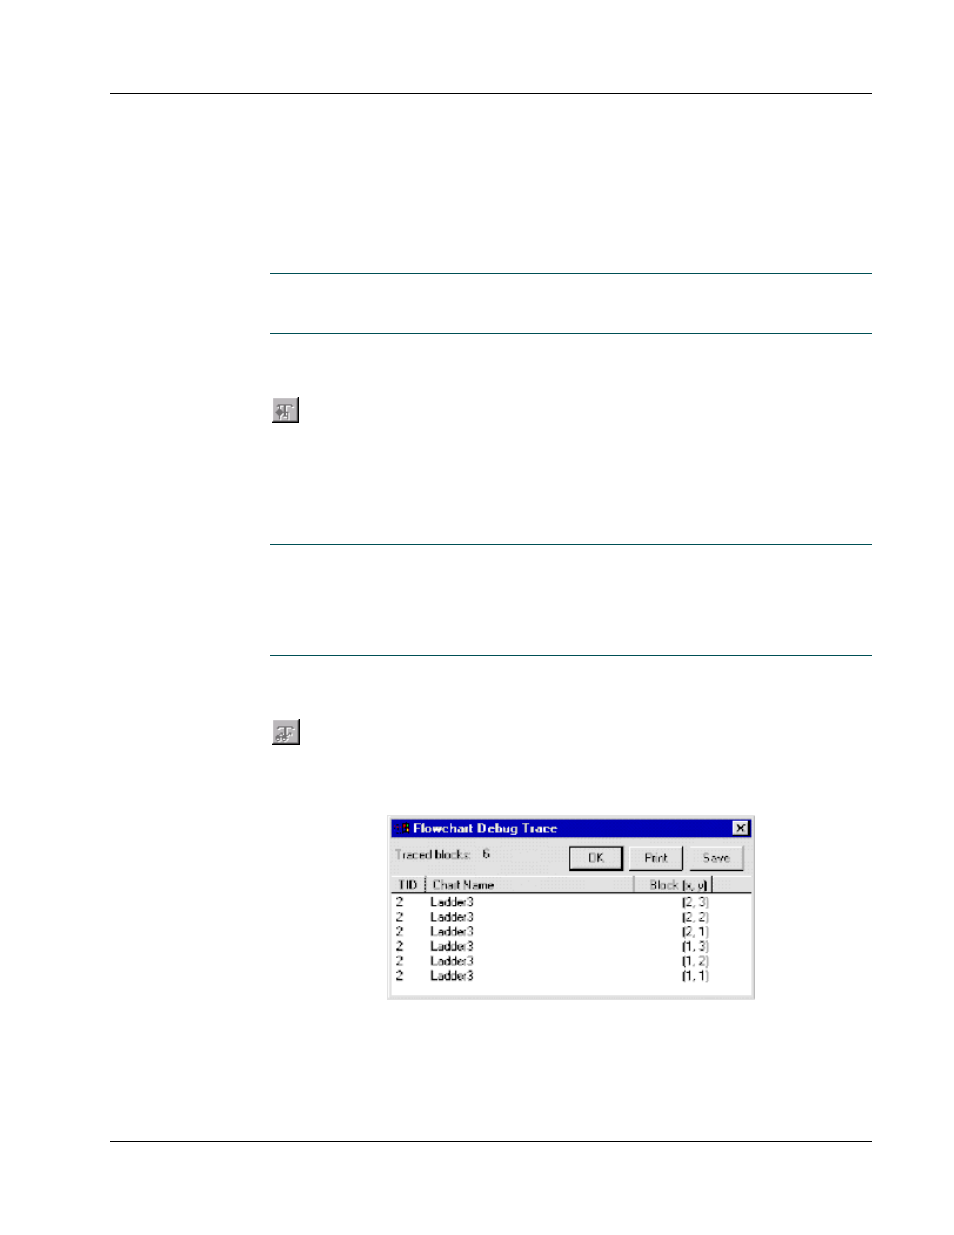
View Debug Trace
In addition to the visual debug trace, a tabular readout of the trace records
can be displayed by selecting the View Debug Trace tool. Trace records are
listed from newest to oldest, and each record shows the name of the chart (or
called subchart) and the object’s coordinates (rung/block). A sample table is
shown below:
The trace records can also be printed or saved to a file for subsequent analysis.