The debugger window, 1 the debugger window – Nematron Pointe Controller User Manual
Page 208
Chapter 7: Monitoring and Debugging
Pointe Controller User Guide
206
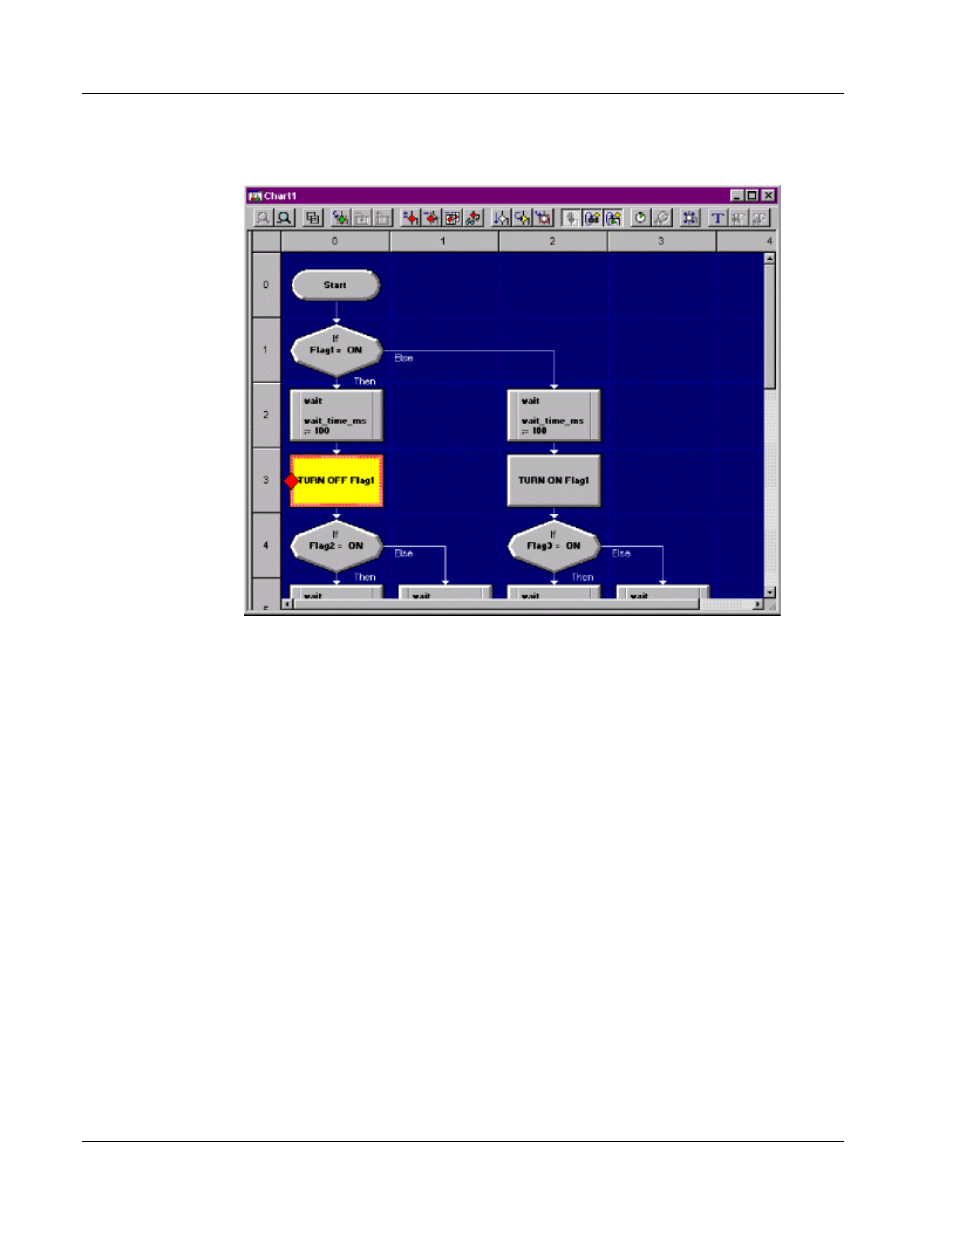
7.3.1 The Debugger Window
The Debugger window displays a real-time view of the selected chart’s activity
and provides tools to interactively control the program flow. The currently active
block is always highlighted; as the program flows, different blocks are
highlighted as they become active.
A toolbar containing icons for each of the tools available to the debugger
appears below the title bar. Most of the tools are usable in both Flow Charts and
Ladder Diagrams, but
some tools are for Flow Charts only
. Each tool is described
later in this document.
Below the toolbar is a workspace area in which the chart is displayed. Scroll bars
will appear as needed to view the diagram, based on
magnification level
and size
of the diagram.
The cursor is always in Select mode within the Debugger window. Any chart block
may be selected by a single-click. Object selection enables some of the tools in the
toolbar and disables others.