Viewing and debugging charts, 3 viewing and debugging charts – Nematron Pointe Controller User Manual
Page 207
Pointe Controller User Guide
Chapter 7: Monitoring and Debugging
205
7.3
Viewing and Debugging Charts
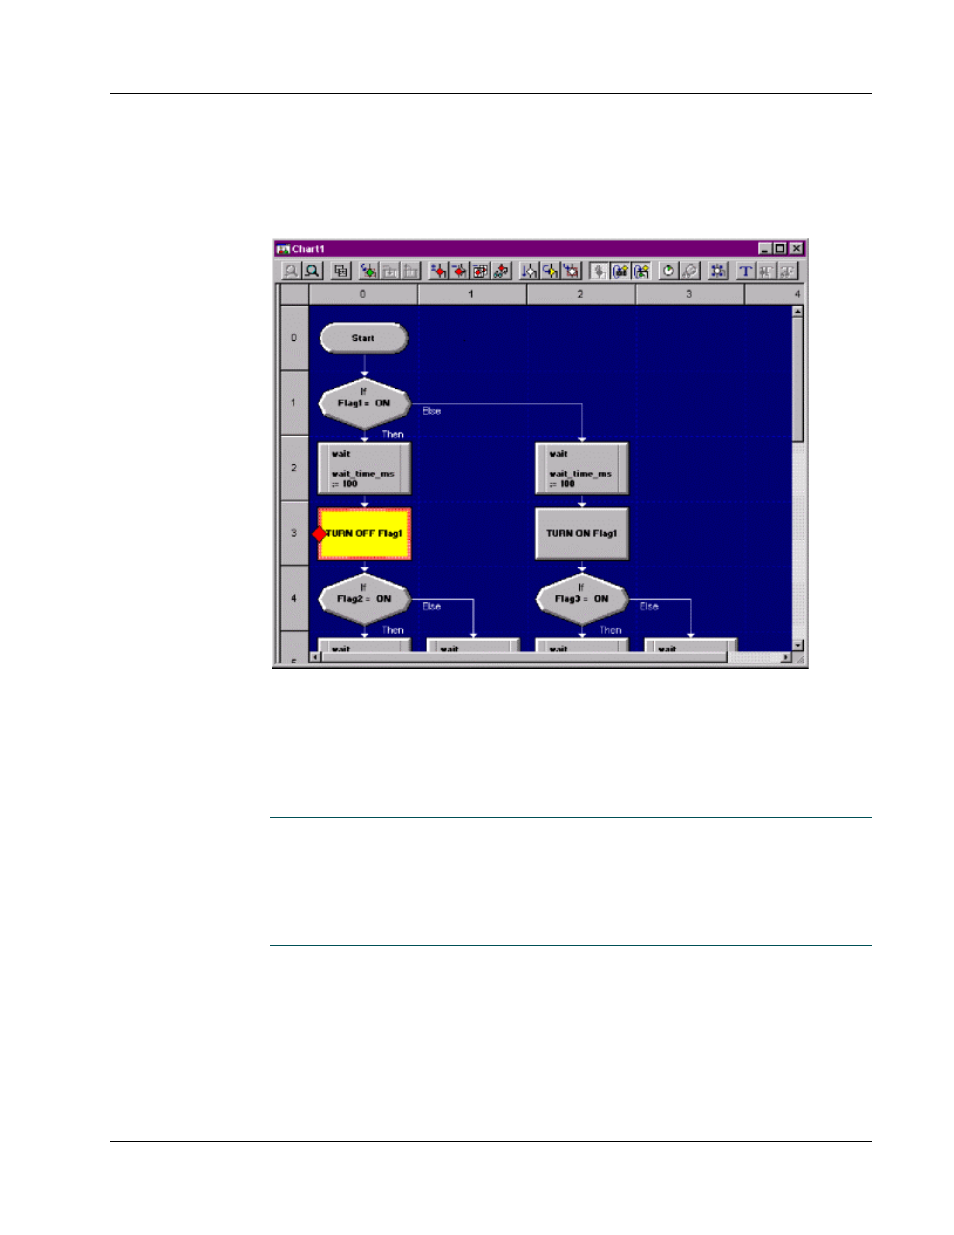
You can open any chart for viewing and debugging by double-clicking on the
chart in the
Charts tab
. The chart will be opened into a new Debugger window:
The Debugger window displays a real-time view of the selected chart’s activity
and provides tools to interactively control the program flow. The Debugger
window highlights the currently active block. As the program flows, different
blocks appear highlighted as they become active.
For more information on the different parts of the Debugger window, proceed to
“
The Debugger window
” on page 206
.
NOTE: When PCM first attaches to a Pointe Controller unit, it attempts to retrieve
the source code of the currently loaded project. The source code is required for
debugging, and it can also be
saved
locally for further editing. By default, the
source code is always loaded onto the controller along with the compiled project.
However, this can be prevented by disabling the Download source to
controller preference in the PointeControl development framework. If the
source code cannot be retrieved, then the project cannot be debugged.