Figure 10-1. typical step response method, Table 10-4. step response method, Table 10-4 – Micromod Micro-DCI: 53SL5100A Single Loop Controller User Manual
Page 110: Cesses. see, Figure 10-1
Single Loop Process Controller Instruction Manual
102 Instrument Tuning
Table 10-4. Step Response Method
Step
Procedure
1
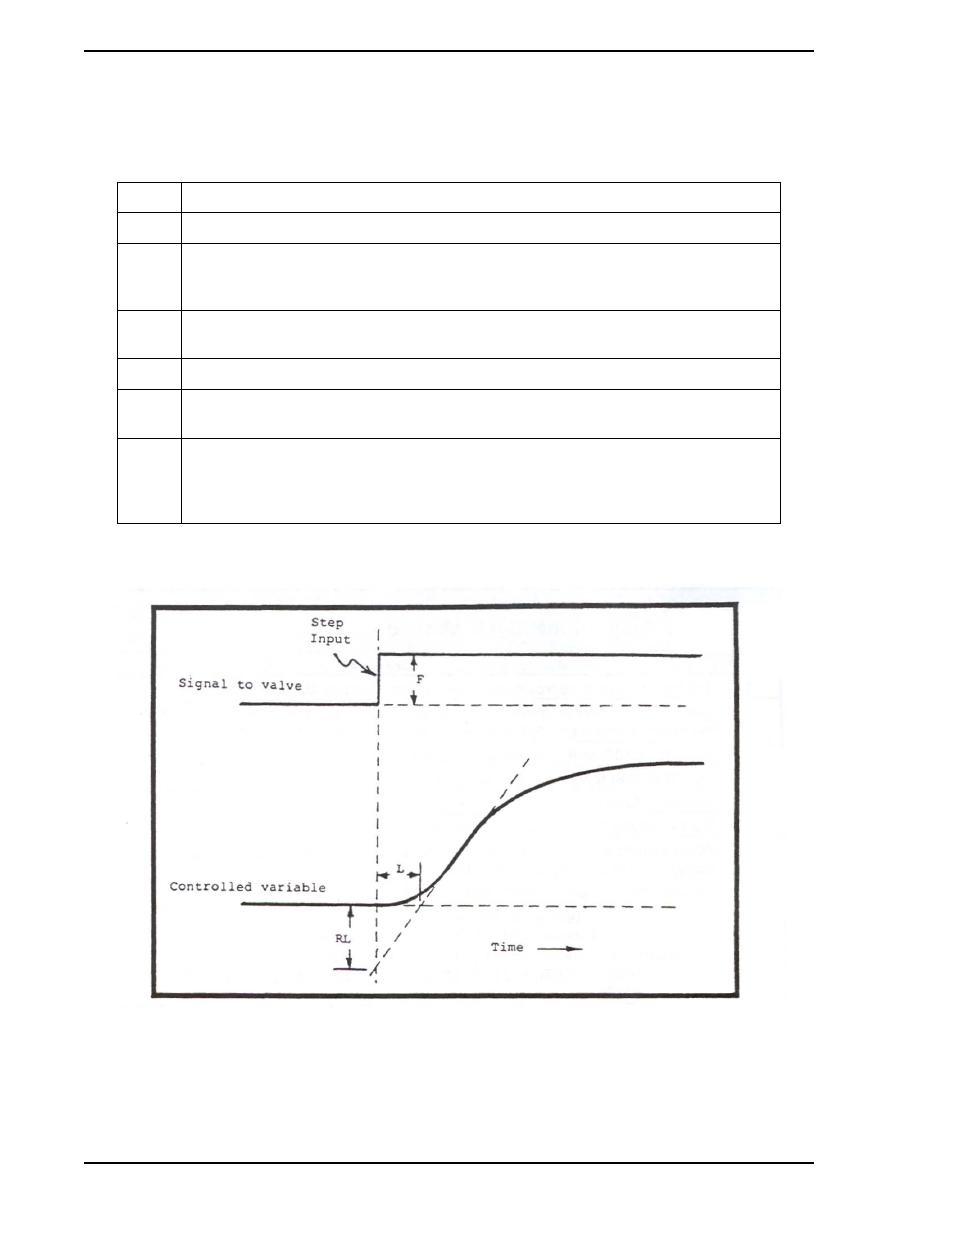
Set the process to approximately normal conditions in Manual mode.
2
Introduce a 10% (approximate) step change to the manually regulated signal to the
valve. Observe the magnitude of the step in percent of full signal span F. Also plot a
graph of the resulting transient curve traced by the controlled variable.
3
Draw a straight line tangent to a point on the curve having the greatest slope (most
linear).
4
Measure the apparent dead time L in minutes as shown in
5
Measure RL, the product of the slope and dead time as shown in
value should be expressed in percent of full scale span.
6
Compute the best settings as follows:
A. Proportional (P): P.B. = (100 RL)/ F.
B. Proportional & Integral(PI): P.B. = (100 RL)/ F, TR = 3L
C. Proportional, Integral, and Derivative (PID): P.B. = (80 RL)/ F, TR = 2L, TD = 0.5L
Figure 10-1. Typical Step Response Method
- Micro-DCI: EP1000A E-Port (56 pages)
- Micro-DCI: 53SL6000 Single Loop Controller (138 pages)
- Micro-DCI: 53SL5100B Single Loop Controller (115 pages)
- Micro-DCI: 53ML5100 Manual Loader (49 pages)
- Micro-DCI: 53MC5000 PLC AND PRINTER INTERFACES (124 pages)
- Micro-DCI: 53MC5000 MicroLink (33 pages)
- Micro-DCI: 53MC5000 Multi-Loop Process Controller Installation (99 pages)
- Micro-DCI: 53MC5000 Multi-Loop Process Controller Instruction Manual (406 pages)
- Micro-DCI: 53MC5000 Multi-Loop Process Controller FLEXIBLE CONTROL STRATEGIES (201 pages)
- Micro-DCI: 53MC5000 Multi-Loop Process Controller CUSTOMIZATION GUIDE (123 pages)
- Micro-DCI: 53IT5100B Micro-DCI 4-Channel Indicator Totalizer (71 pages)
- Micro-DCI: 53MC5000 Training Manual (180 pages)
- Micro-DCI: 53SL5100A Single Loop Controller Rev. 1 Firmware (6 pages)
- Micro-DCI: 53ML5100A LOADING STATION REV. 1 FIRMWARE (20 pages)
- Micro-DCI: 53ML5100A LOADING STATION (55 pages)
- Micro-DCI: 53IT5100A Indicator/Totalizer Rev. 1 Firmware (4 pages)
- Micro-DCI: 53IT5100A Indicator/Totalizer (80 pages)
- MOD: 2001P - MODCELL Logic Control Identity Module (Version 6) System, I/O and Communications Functions (272 pages)
- MOD: 2001P - MODCELL Logic Control Identity Module (Version 6) Algorithms, Tables and Sequential Logic Functions (160 pages)
- MOD: 2004P - MODCELL Continuous Control Identity Module (Version 3) PID and Ramp/Soak Functions (70 pages)
- MOD: 30ML and Modcell Totalization Application Guide (24 pages)
- MOD: 30ML and Modcell Maintenance for 2001N, 2002N, and 1800R (152 pages)
- MOD: Remote I/O Modules for use with 2020N Remote I/O Interface Module (42 pages)
- MOD: MODCELL Multiloop Processor 2002N Model C and Associated Hardware (82 pages)
- MOD: 30ML Installation (106 pages)
- MOD: 30ML Replacement for MOD30 Instruments (36 pages)
- MOD: 30ML Installation for Replacing SLC/CLC Instruments (68 pages)
- MOD: 30ML Function Code Configuration Guide for Replacing SLC/CLC Instruments (394 pages)
- MOD: 30ML Operation and Template Setup (84 pages)
- MOD: 30ML Functions Data Base Reference (152 pages)
- MOD: 30ML Display Script Guide (98 pages)
- MOD: 30ML FrontFace Configuration Charts (6 pages)
- MOD: 30ML Quick Reference Guide (2 pages)
- MOD: 30ML Controller Operation and Maintenance Training Manual (74 pages)
- MOD: Modcell 2050R Users Guide (228 pages)
- MOD: Modcell 2050R MODBUS Communications (70 pages)
- MOD: Modcell 2050R Quick Reference Guide (2 pages)
- MOD: Modcell 2050R Mounting Dimensions (1 page)
- MOD: Modcell 2050R 2050FZ0, QS-1300/1400 to 2050R Conversion Accessory (10 pages)
- MOD: Modcell 2050R 2051FZ2, Foxboro 62H to 2050R Conversion Accessory (4 pages)
- MOD: Modcell 2050R 2051FZ1 and 2051FZ1, Foxboro SPEC 200 to 2050R Conversion Accessory (4 pages)
- MOD: 1731N ICN Mini-Link Users Guide (28 pages)
- MOD: 1732N, 1733N External Mini-Link Users Guide (22 pages)
- MOD: ICN OPC Server Users Guide (38 pages)