Point, Segment – Turning Technologies ExamView User Manual
Page 147
ExamView Test Generator
147
13
By default, the number line displays tick marks and tick-mark labels. To show or hide these click the Show tick marks
and Label tick marks check boxes.
14
Click Zoom In and Zoom Out to change the units per tick. Zooming in or out automatically applies changes to the
number line.
15
Click the View tab, enter a width, height, and baseline (in inches) for the number line. You can also manually set
these values from the editing window by clicking and dragging the resize handles.
16
Select set center or set left. Enter a coordinate value in the appropriate section.
17
Click the Web tab, enter alternate text to be displayed when the student points to the graph while taking an online test.
18
Click Apply to view your changes in the editing window or click OK to record your changes and close the Format Graph
– Number Line window.
NOTE
If you inadvertently apply changes that you do not want to the number line, close the Format
Graph – Number Line window, click Edit from the menu bar and select Undo. This will
cancel all changes made while the window was displayed, including inserting new items.
Point
1
Insert a number line into a question, answer, matching group, or narrative.
To edit an existing number line, double-click the graph or click Format from the menu bar and select Format Graph.
2
Click the Functions tab, select Point from the drop-down menu and click New.
3
Enter the coordinate of the point.
NOTE
Variables can be used as values for the point coordinate and the label.
To display ”r;+” and/or ”r;–”r; in the label, you must enclose the label in quotes. For example:
”r;+5”
4
Select a point style. The point styles can be none, solid, or hollow.
5
Select a label style. You can have no label, use the coordinate of the point as the label, or optionally enter a text label.
Click Font to set the font characteristics of the label.
6
Select a label position. You can select where the label appears in relation to the point.
7
To display the point only if a certain condition is met, enter the condition in the field following Display point (only if ).
8
To change the color of the point, click the Color drop-down menu . To change the color of the label, click Font.
9
Click Apply to view your changes in the editing window or click OK to record your changes and close the New Point
window.
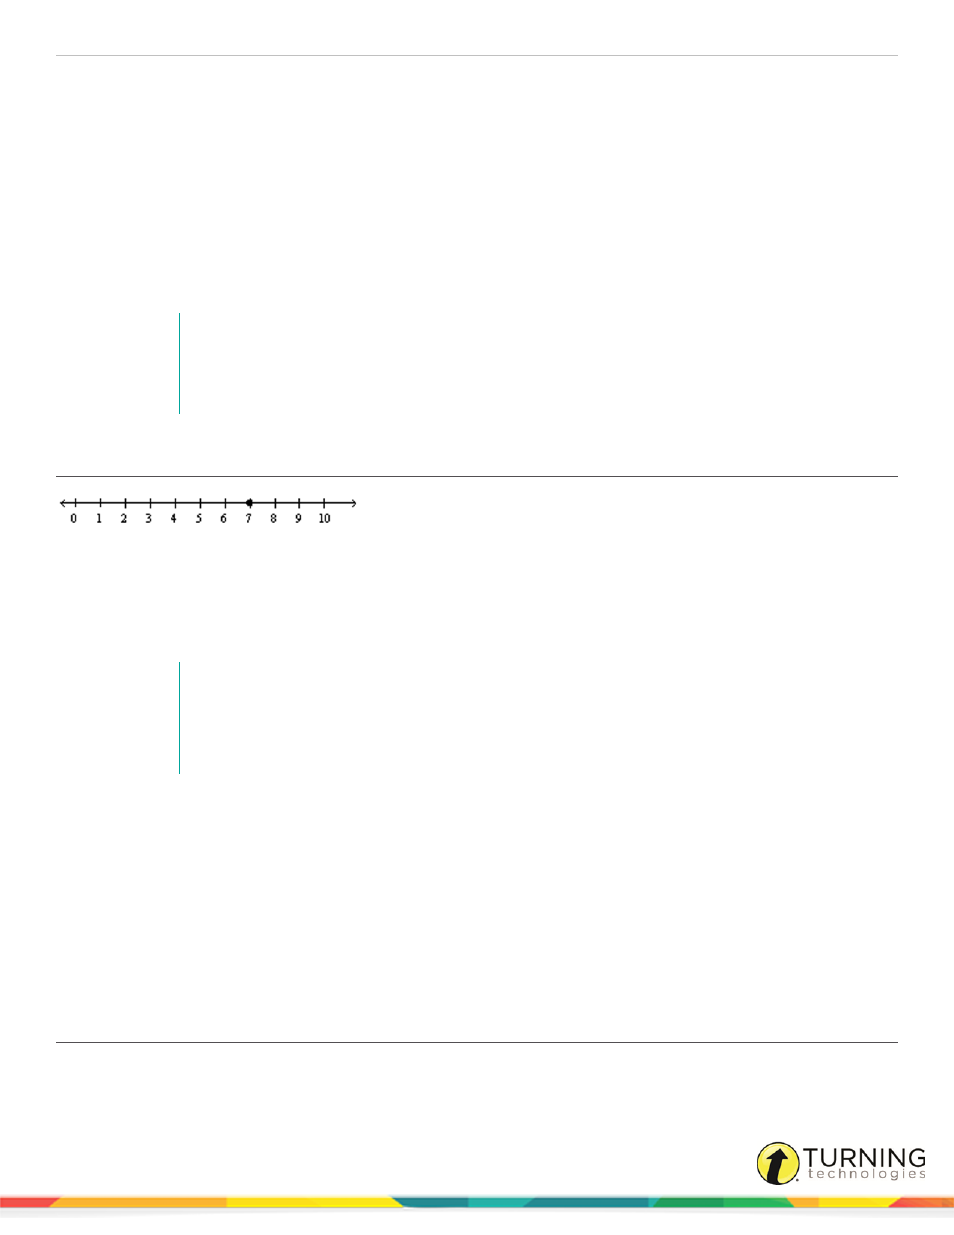
Segment
A segment can be used to show that a variable is greater than one value and less than another. For example, the segment on
the number line below demonstrates a value greater than two and less than or equal to nine.
turningtechnologies.com/user-guides