F(x) or f(y) – Turning Technologies ExamView User Manual
Page 130
ExamView Test Generator
130
17
Select a background style for the graph. The background can be blank, dotted, or lined. If you select a lined or dotted
background, you can also choose a color. By default, the background is blank. Lined or dotted backgrounds help define
the coordinate system.
18
Set the center or the lower left of the graph. Enter x, y coordinate values in the appropriate section.
19
Click the Web tab to enter alternate text to be displayed when the student points to the graph while taking an online
test.
20
Click Apply to view your changes in the editing window or click OK to record your changes and close the Format Graph
– Cartesian window.
TIP
If you inadvertently apply changes that you do not want to the graph, close the Format Graph
– Cartesian window, click Edit from the menu bar and select Undo. This will cancel all
changes made while the window was displayed, including inserting new items.
f(x) or f(y)
1
Insert a Cartesian graph into a question, answer, matching
group, rationale, feedback, or narrative.
To edit an existing graph, double-click the graph or click
Format from the menu bar and select Format Graph.
2
Click the Functions tab, select f(x) or f(y) from the drop-down
menu and click New.
3
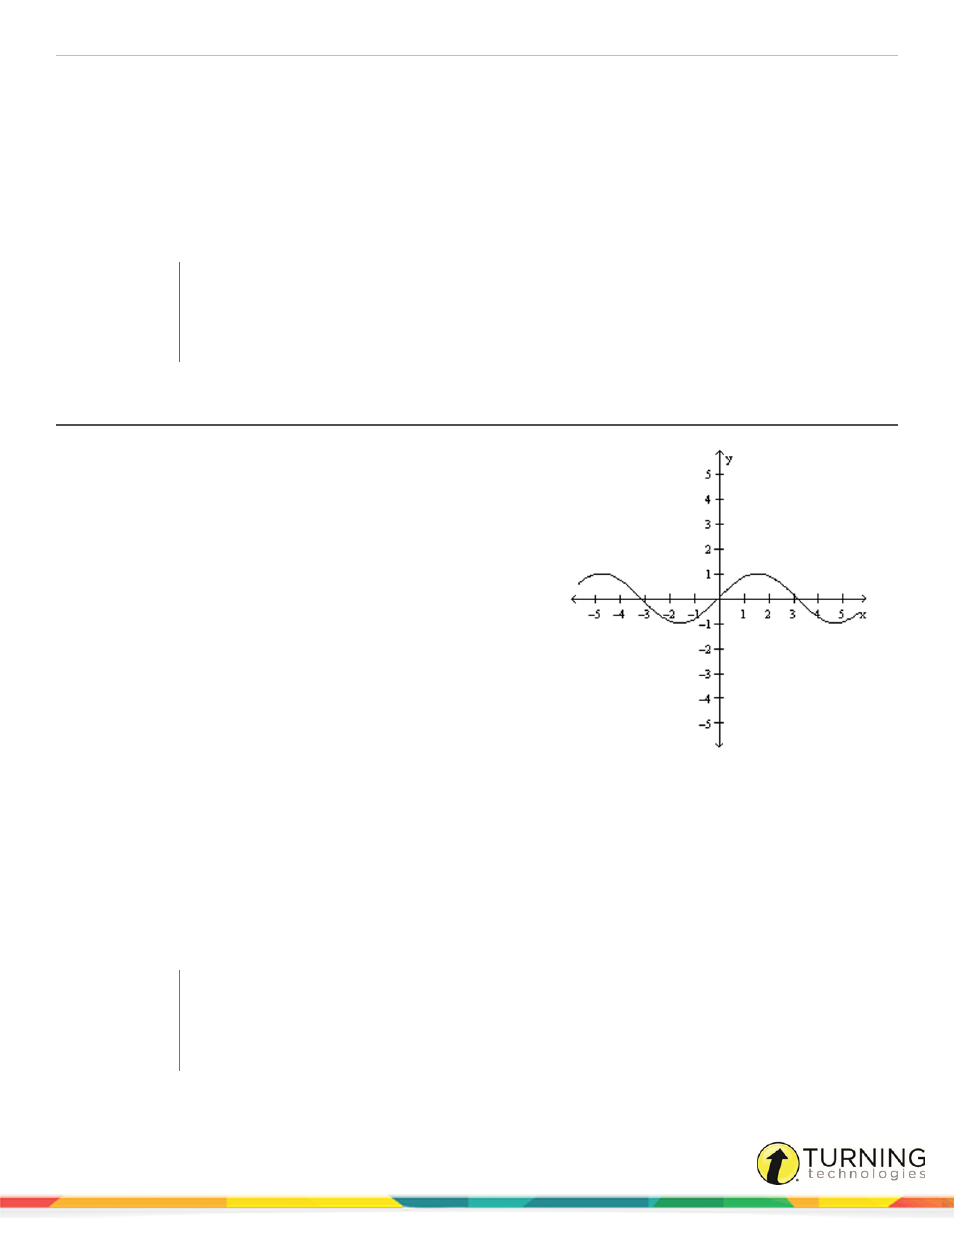
Enter a function using x or y as the variable. The example
shown above shows the function sin(x). Use the same
algorithmic syntax used to define variables.
4
Select a relation from the drop-down menu: equals, less than,
less than or equal to, greater than; or greater than or equal to.
The relation determines the line style for the function as well
as whether the area above or below the function is shaded.
5
Enter the domain of the function. The default domain for
functions of x or y is from -inf(infinity) to inf(infinity).
6
Optionally, to display the function only if a certain condition is met, enter the condition in the field following Display
function (only if).
7
To change the drawing style for the function, click the Pattern drop-down menu .
8
To change the color of the function, click the Color drop-down menu .
9
To change the style for the shaded region, click the Shading drop-down menu . If the relation is ”r;=”, the shading style
is not used.
10
Click Apply to view your changes in the editing window or click OK to record your changes and close the New Function
window.
NOTE
Variables can be used anywhere in the function definition or as values for the domain. Click
the Add from List button next to the function definition to display a list of currently defined
variables, constants, and keywords.
turningtechnologies.com/user-guides