IAI America RCM-101-USB User Manual
Page 246
13. Frequency
Analysis Function for SCON-CA
Controller
Anti-V
ibration Control
234
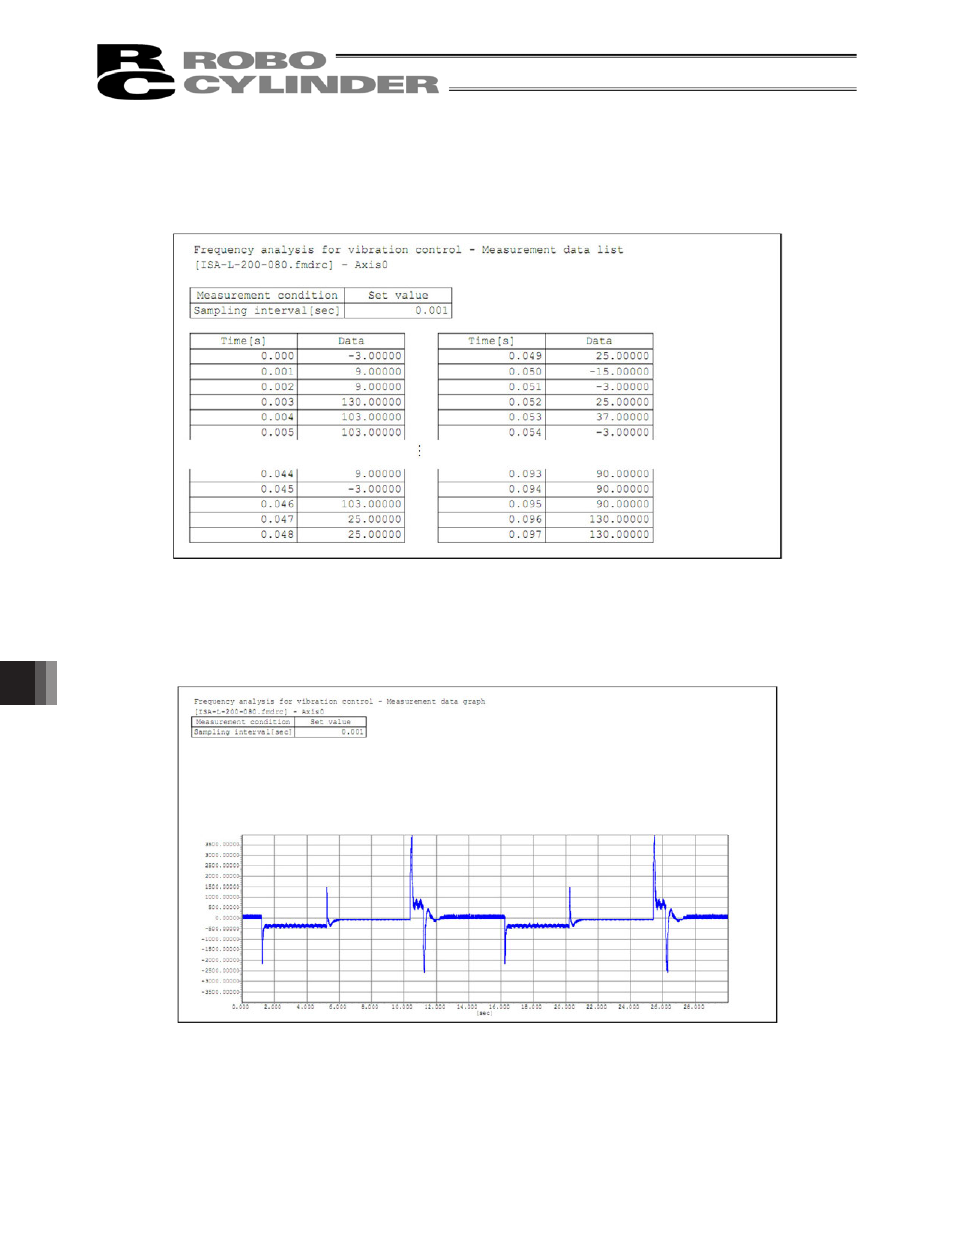
• Print list:
Measurement data included in the range specified in the “Setting for print list range” area is printed in the
format shown below.
Fig. 13.35 Printing Format of Measurement Data List
• Print Graph
The measurement data graph currently displayed in the “sampling” window is printed in the format shown
below.
Fig. 13.36 Printing Format of Measurement Data Graph
This manual is related to the following products: