IAI America RCM-101-USB User Manual
Page 241
13. Frequency
Analysis Function for SCON-CA
Controller
Anti-V
ibration Control
229
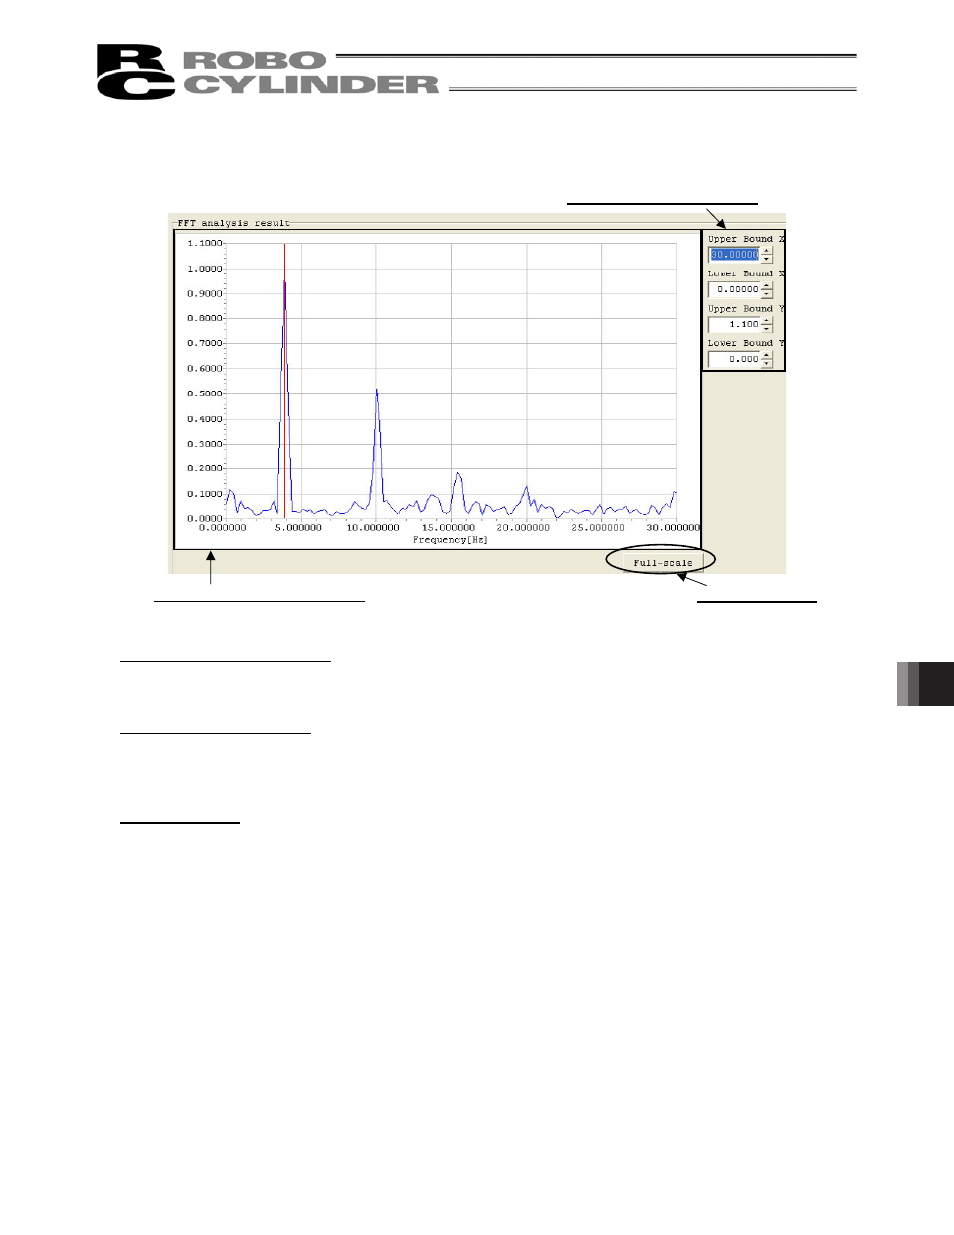
[1] FFT analysis result data
Fig. 13.28 FFT Analysis Result Data Graph
FFT analysis result data graph
FFT analysis result of the measured axis is displayed in a graph.
FFT analysis result data is displayed in a normalized pattern based on the maximum value of data being 1.
Graph display range setting
You can change the display area of the graph by changing the values set in the four input fields.
The value set in each input field can also be changed using the buttons on the right side of the field.
Note that a range wider than the scale effective when the
Full-scale button is clicked cannot be displayed.
Full-scale button
Clicking this button lets you display in a graph all FFT analysis result data in the range from 0 to the
maximum frequency [Hz] that permits forwarding of data to the controller.
Graph display range setting
Full-scale button
FFT analysis result data graph