What are the interactive graphs – E-Mon Energy Software User Manual
Page 34
Windows Components and Navigation
E-Mon Energy User Manual
4-7
E-MON
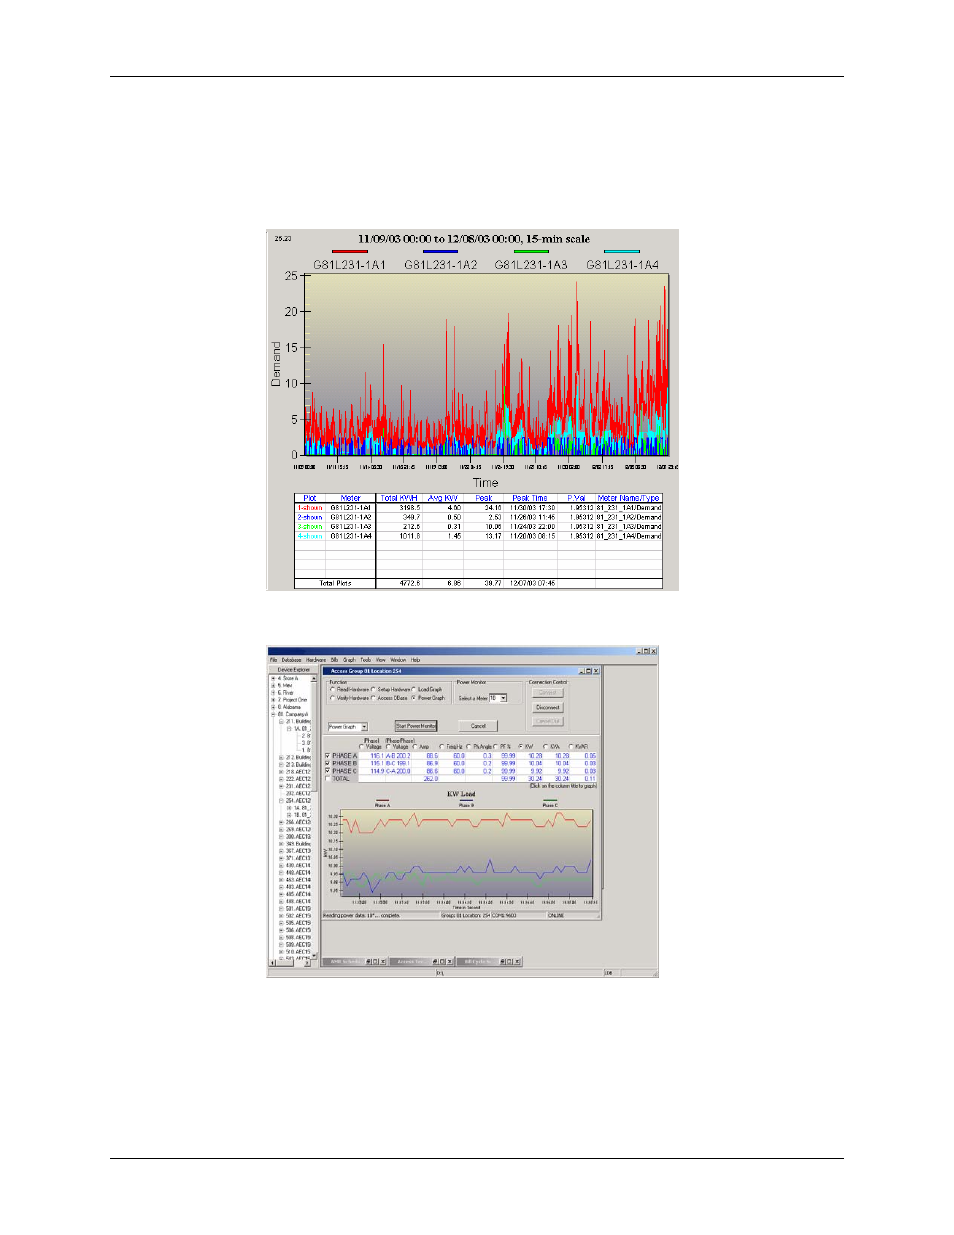
What are the Interactive Graphs?
E-Mon Energy™ provides several interactive graphs - the Demand Profile, Power Graphs, and Real-Time Load
Profile graphs. The following illustrates two examples of these graphs.
Figure 4.12 - Demand Profile
Figure 4.13 - Power Graph