What is the statistic table – E-Mon Energy Software User Manual
Page 169
Real-Time Graphs
E-Mon Energy User Manual
17-2
E-MON
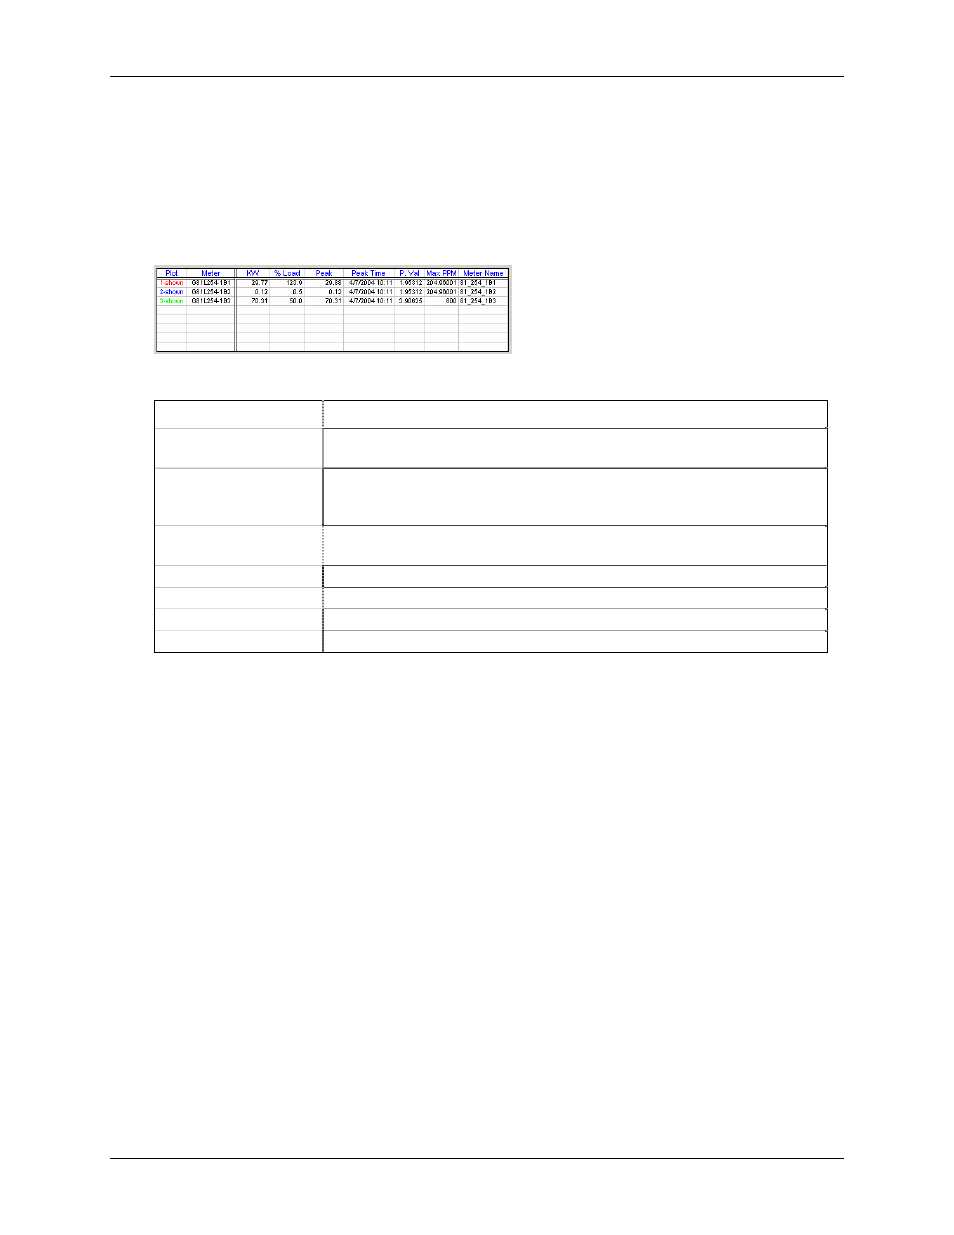
What Is the Statistic Table?
The Statistic Table is a chart that provides a real-time data view of each device in tabular representation – KW,
Percentage Load, Peak, Peak Time, P. Val (Pulse Value), Max PPM (Pulse Per Minute), and Meter Name. The table
acts as a legend for the graph, with each device color-coded under the plot column. These colors can be associated
with the graph. To clear the table, right-click on the grid area and select “Delete this plot” or “Delete All”. The
following illustration shows a populated Statistic Table.
Figure 17.2 - Statistic Table
Columns
Description
KW
This column displays the instantaneous KW demand, which is updated every
minute.
% Load
This column displays the percent of rated load of the particular meter. (i.e. a
meter has an amperage rating of 200 amps. The % Load column shows 10
%. This means that 20 amps is the current draw.)
Peak
This column displays the maximum Kilo-watts for each meter since the
graph started.
Peak Time
This column displays the date and time of the Peak kW within 15 minutes.
P. Val
This column displays the rated Pulse Value for the meter.
Max PPM
This column displays the rated Maximum Pulse Per Minute.
Meter Name
This column displays the Meter Name as specified in the database.
The data cannot be populated into the table until the Start Load Monitor button is selected. Once selected, the table
will populate and the Load Factor Graph will begin to move and chart the KW load in minutes. A scroll-bar is
provided to move left or right to review previous data or view actual recorded measurements.