E-Mon Energy Software User Manual
Page 162
Demand Profile Graph
E-Mon Energy User Manual
16-7
E-MON
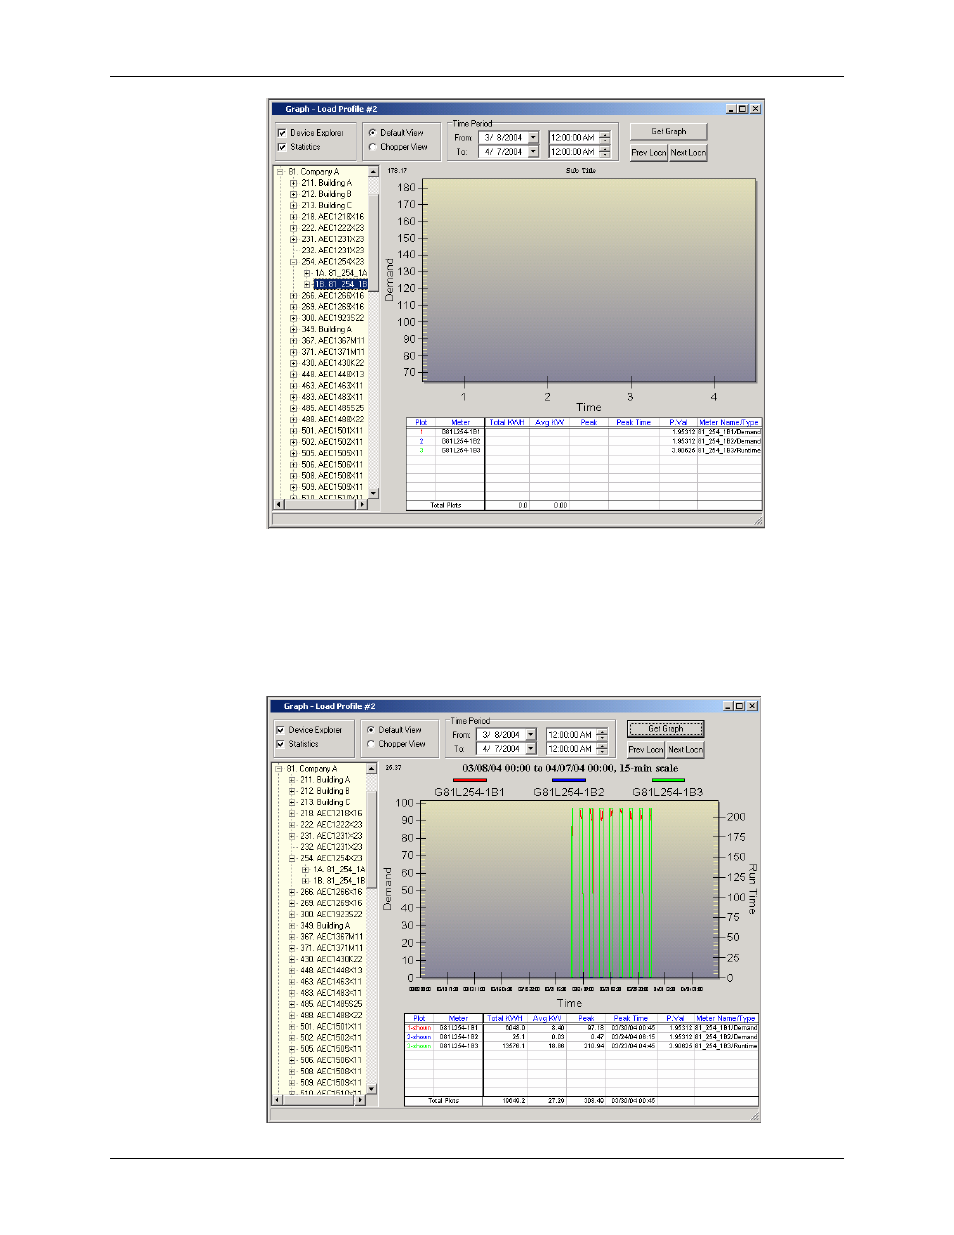
Figure 16.11 - Demand Profile Statistic Table
Plotting the Graph
8
Click on the Get Graph button.
The statistic table refreshes and populates with the Total KWH, Average KW, Peak, and
Peak Time during the selected Time Period. The graph above plots the rise and fall of the
load as KWs on a Date/Time frame. Above the plotted graph it displays the meter ID(s) and
color code.
Figure 16.12 - Demand Profile Graph