What is the power graph, Can i change the graph display view – E-Mon Energy Software User Manual
Page 170
Real-Time Graphs
E-Mon Energy User Manual
17-3
E-MON
What Is the Power Graph?
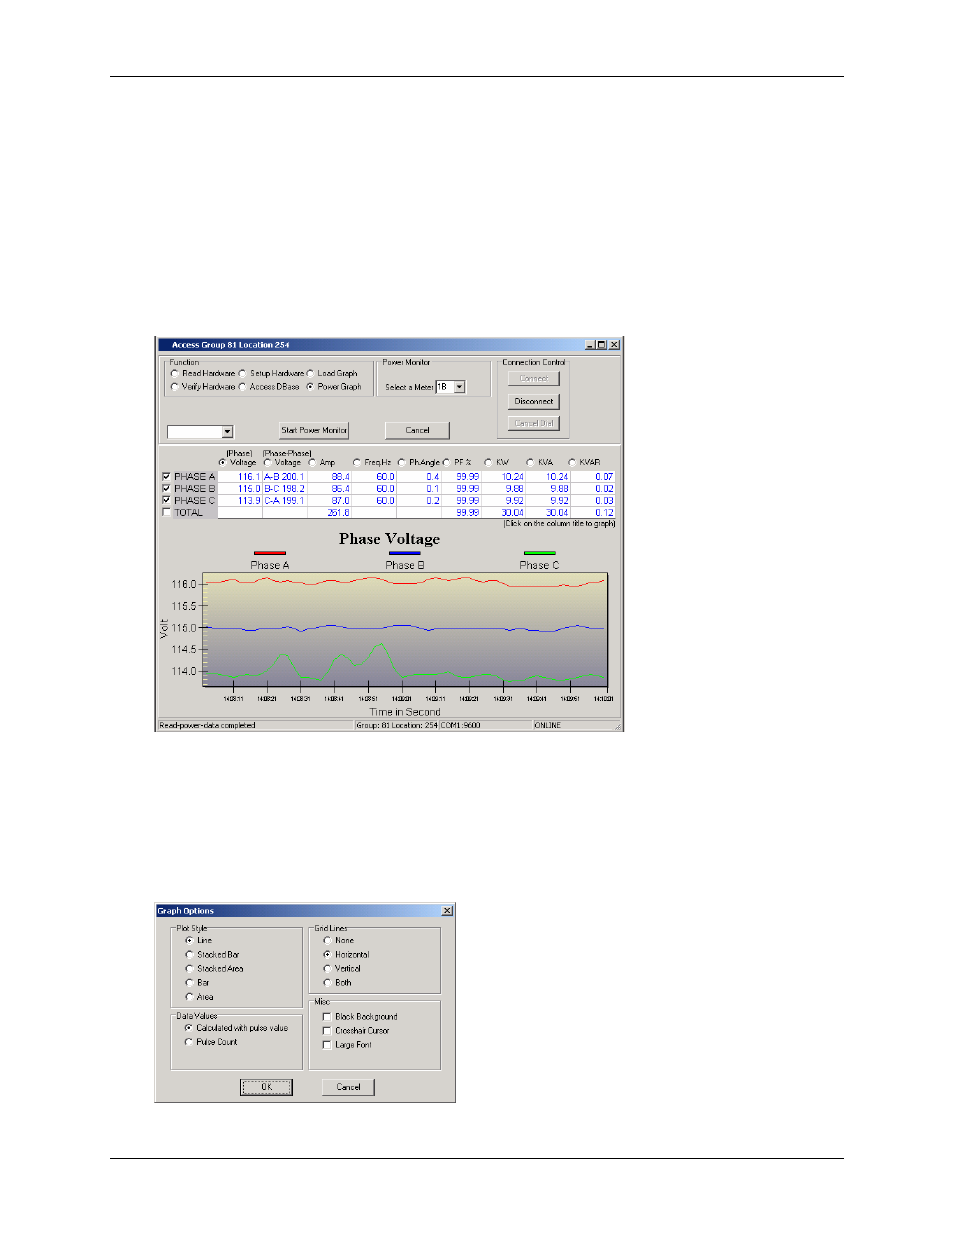
The Power Graph is a graph that provides information on power quality. The Power Graph displays different power
measurements. The user can view each measurement by clicking on the radio button next to each power
measurement (Phase Voltage, Phase-Phase Voltage, Amps, Freq. Hz, PH. Angles, PF%, KW, KVA and KVA).
Above the graph is a table grid that displays the real-time power phases (Phase A, B, and C) along with the Total for
some of the measurements. The user has an option on which real-time power phases and totals to view by clicking
on the corresponding check box. To run the Power Graph, a recorder (Class 3000 or MeterSmart 5000) device must
be first selected from the Just One drop-down field under the Hardware to Access group. Once the device is selected,
you can begin monitoring by clicking the Start Power Monitor button. The illustration below shows a Power
Graph.
Figure 17.3 - Power Phase Voltage Graph
Can I Change the Graph Display View?
Yes, E-Mon Energy™ provides Graph Viewing Options to plot different styles. This feature is accessible from the
main menu under Graph, then from the Graph drop-down menu select Display Option. There are several display
options to choose – Line, Stacked Bar, Stacked Area, Bar, and Area. See the Demand Graph section for definitions
of each radio buttons.
Figure 17.4 - Graph Options