Can i see the data in a pie chart, Can i print the graph – E-Mon Energy Software User Manual
Page 159
Demand Profile Graph
E-Mon Energy User Manual
16-4
E-MON
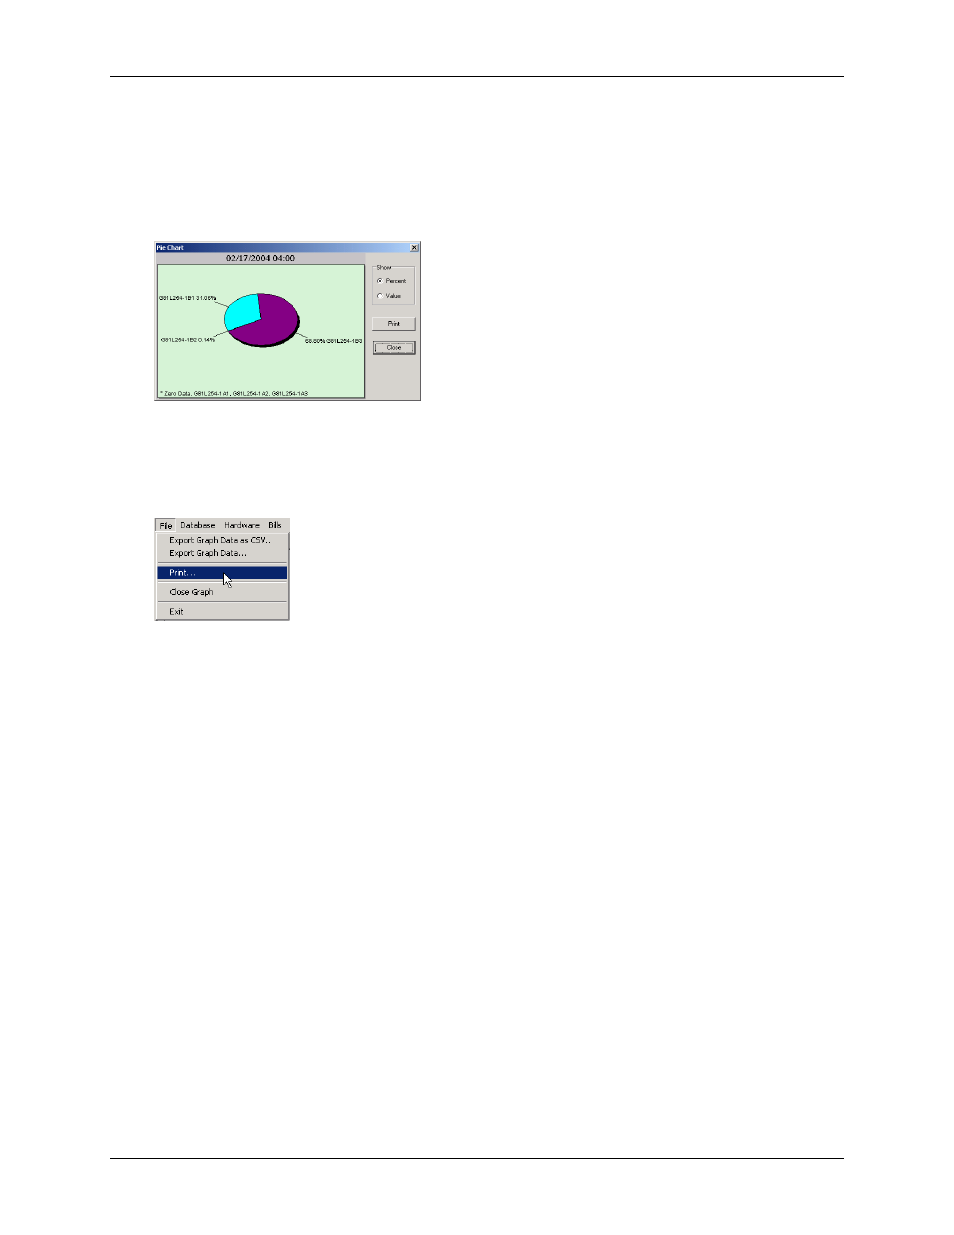
Can I See the Data in a Pie Chart?
Yes. By double-clicking on the data point, a pie chart will open. The chart below shows the percentage of each
meter graphed, which contributes to the total kW demand registered at the time chosen. The date/time of the period is
shown at the top of the window. On the right-hand side of the window is the Show group, by selecting the radio
button marked Values, the actual values in kW will be shown instead of the percentages. A Print button is provided
if you wish to print the pie chart.
Figure 16.6 - Pie Chart View
Can I Print the Graph?
Yes. You can print just by selecting File\Print from the main menu.
Figure 16.7 - Print Graph Menu