E-Mon Energy Software User Manual
Page 165
Demand Profile Graph
E-Mon Energy User Manual
16-10
E-MON
Exporting Graph Data
1
To export graph data as a CSV (common-separated variable) file, select File/Export Graph
Data as CSV
. A Save As dialog opens to save with a CSV extension.
Note: The CSV file format is used to exchange data between different applications (i.e. MS
Excel).
2
Enter a File Name and click the Save button.
Figure 16.17 - Export Graph Data as CSV Menu
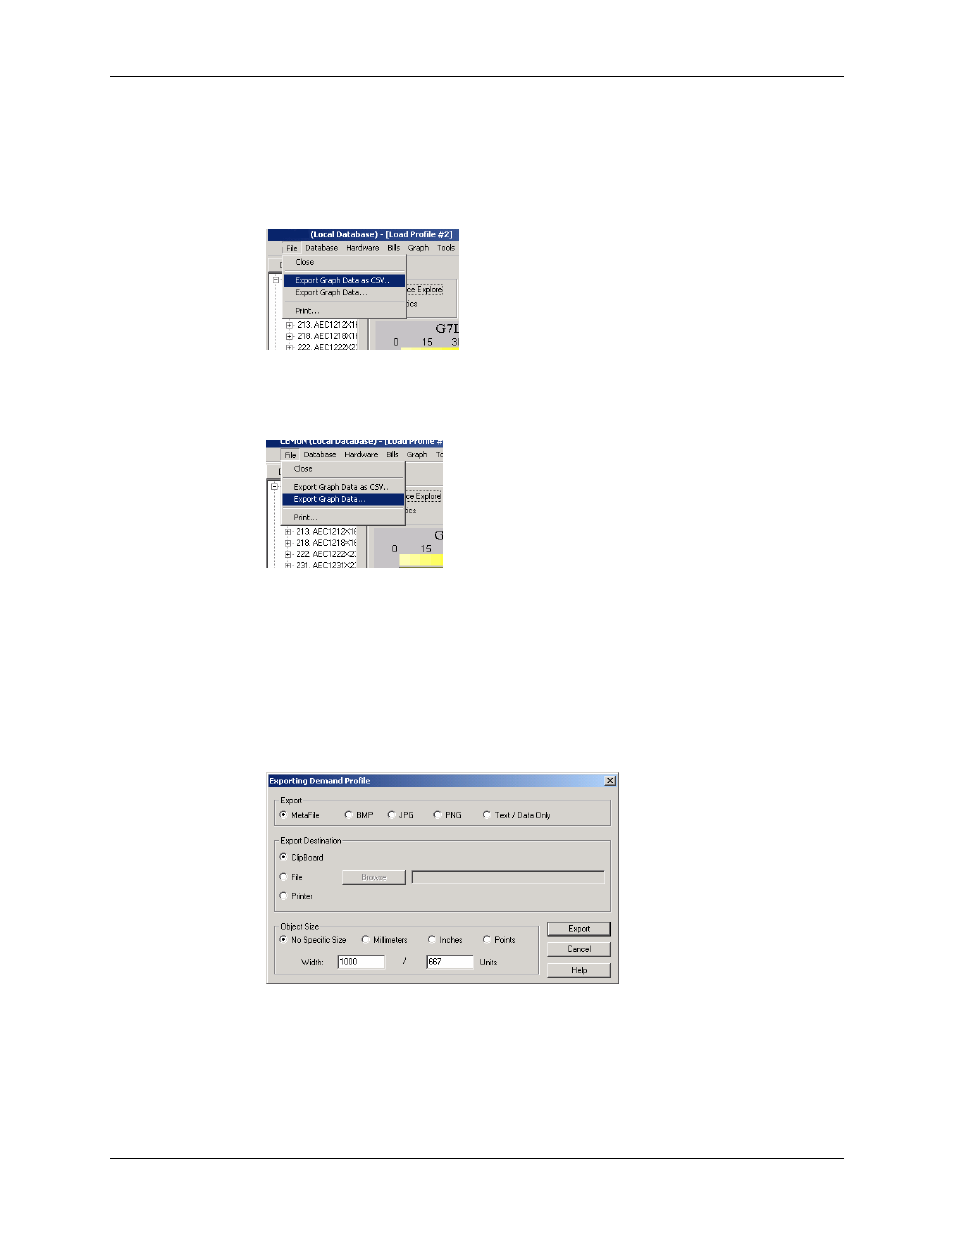
3
To export graph data in other formats, select Export Graph Data. An Exporting Demand
Profile
dialog opens.
Figure 16.18 - Export Graph Data Menu
4
Select an Export format. The Exporting Demand Profile dialog displays several format
options to use. Metafile, BMP, JPEG, PNG, and a Text delimited file that can be imported
into a spreadsheet.
5
Select an Export Destination location (to a Clip Board, as a File, or send to a Printer).
6
If saving as an image, select the object size or Pixel.
7
Click on Export to save the file and complete the file parameters.
8
To Print the graph image, click on Print. (The print button appears when the Printer radio
button is selected)
Figure 16.19 - Exporting Demand Profile Dialog