E-Mon Energy Software User Manual
Page 161
Demand Profile Graph
E-Mon Energy User Manual
16-6
E-MON
Click and type inside the text box to change each time increment or click on the S up T
down arrows to adjust the time frame for each increment.
Note: The Start Time cannot exceed the End Time.
5
In the To (time) field, set the time (hrs: min: sec: AM/PM) to Stop at.
6
In the shaded device directory, select a Group, click and drill-down to the Recorder Level.
Then click and drag to the Meter Level, if you wish to graph a single meter.
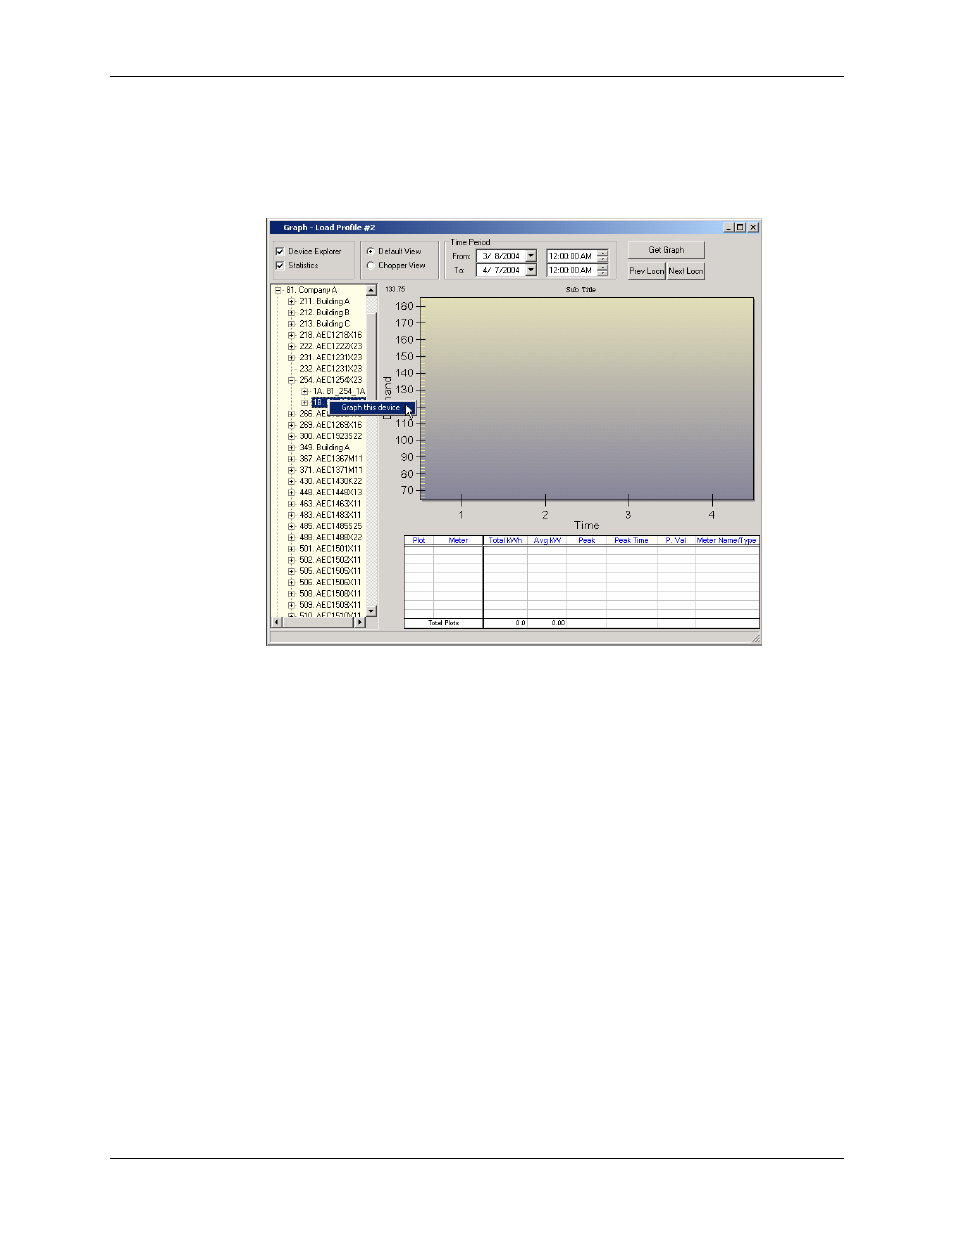
Figure 16.10 - Demand Profile Device Selection
7
Right-click on the Recorder ID and highlight it, then left-click on Graph this Device
button. The illustration below shows a statistic table populated with all the meters within the
selected recorder.
Note: Each Meter is shown with a specific color to correspond with the plot number.