Can i change the graph display view – E-Mon Energy Software User Manual
Page 158
Demand Profile Graph
E-Mon Energy User Manual
16-3
E-MON
Can I Export the Interval Data to Other Applications?
Yes. E-Mon Energy™ has the capability of exporting data as a Comma Separated File (CSV file extensions) as well
as other compatible spreadsheet applications. To export the data for the selected device, you must have selected from
the main menu bar File to Export Graph Data as CSV or Export Graph Data. At this point, a save dialog box will
open to save the file.
Figure 16.4 - Export Graph Data
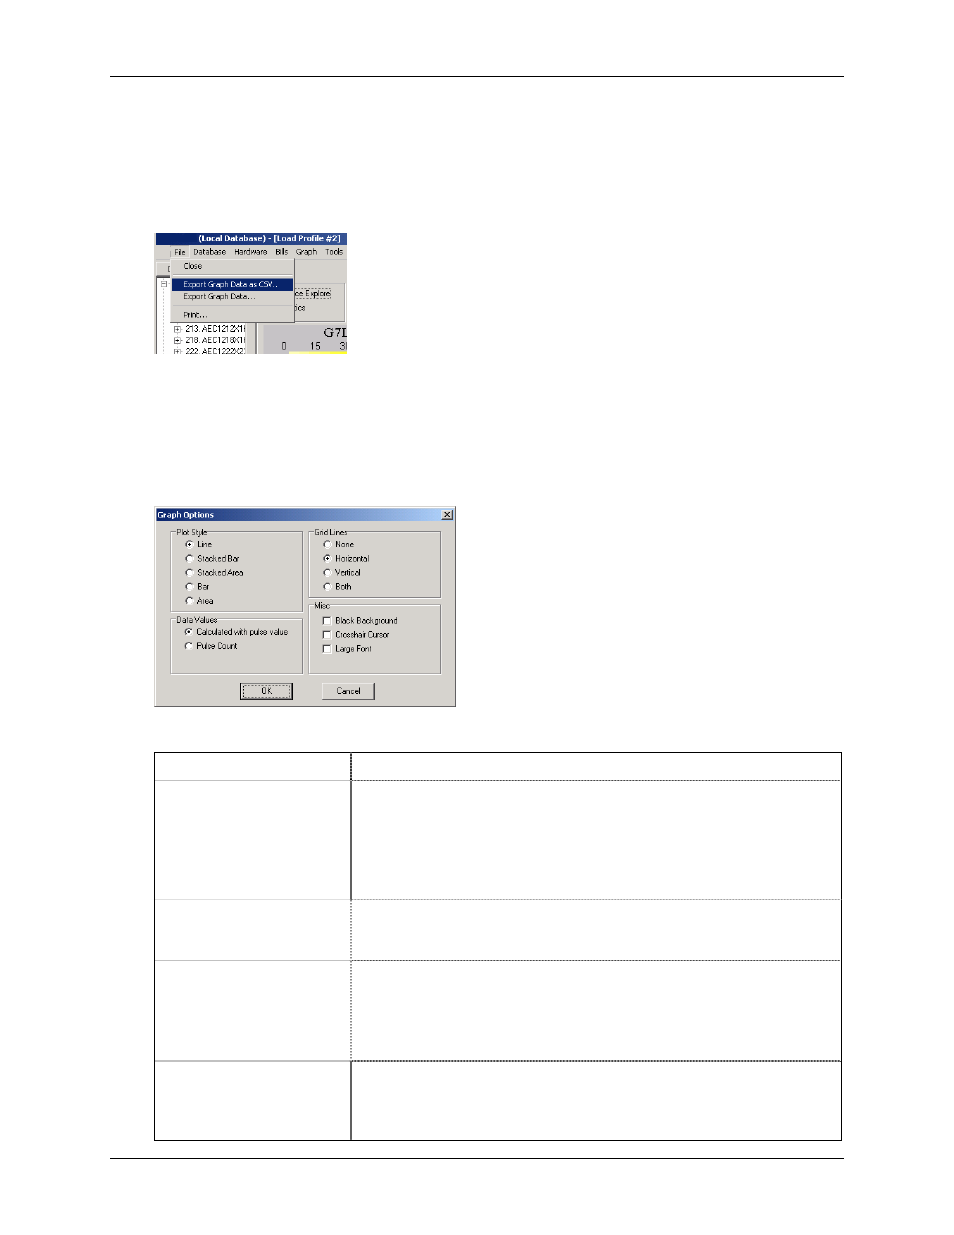
Can I Change the Graph Display View?
Yes. E-Mon Energy provides several graph options to view different plot styles. From the main menu, select Graph
then Display Option to open the dialog. There are several display options to choose from – Line, Stacked Bar, Stack
ed Area, Bar, and Area. The illustration and table below describes each of the graph options.
Figure 16.5 - Graph Options
Panel Group / Field
Description
Plot Style
Panel Group.
Select a radio button.
Line
= Displays each kW Demand per date/time.
Stacked Bar =
Displays total kW Demand per date/time (all plots).
Stacked Area
=
Displays total kW Demand per date/time (all plots).
Bar
= Displays side by side each kW Demand per date/time.
Area
= Displays area kW Demand per date/time (all plots).
Data Values
Panel Group.
Select a radio button.
Calculated with pulse value
= Graph data with multiplier factored in.
Pulse Count
= Graph data using raw pulse.
Grid Lines
Panel Group.
Select a radio button.
None
= No grid on the graph.
Horizontal
= Add horizontal grid lines on the graph.
Vertical
= Add vertical grid lines on the graph.
Both
= Add both horizontal and vertical grid lines on the graph
Misc.
Panel Group.
Check boxes (Multi-selections).
Black Background
= Displays the graph with a black background.
Crosshair Cursor =
Changes the cursor to a “+” instead of an arrow.
Large Font =
Enlarges the font on the display screen.