E-Mon Energy Software User Manual
Page 164
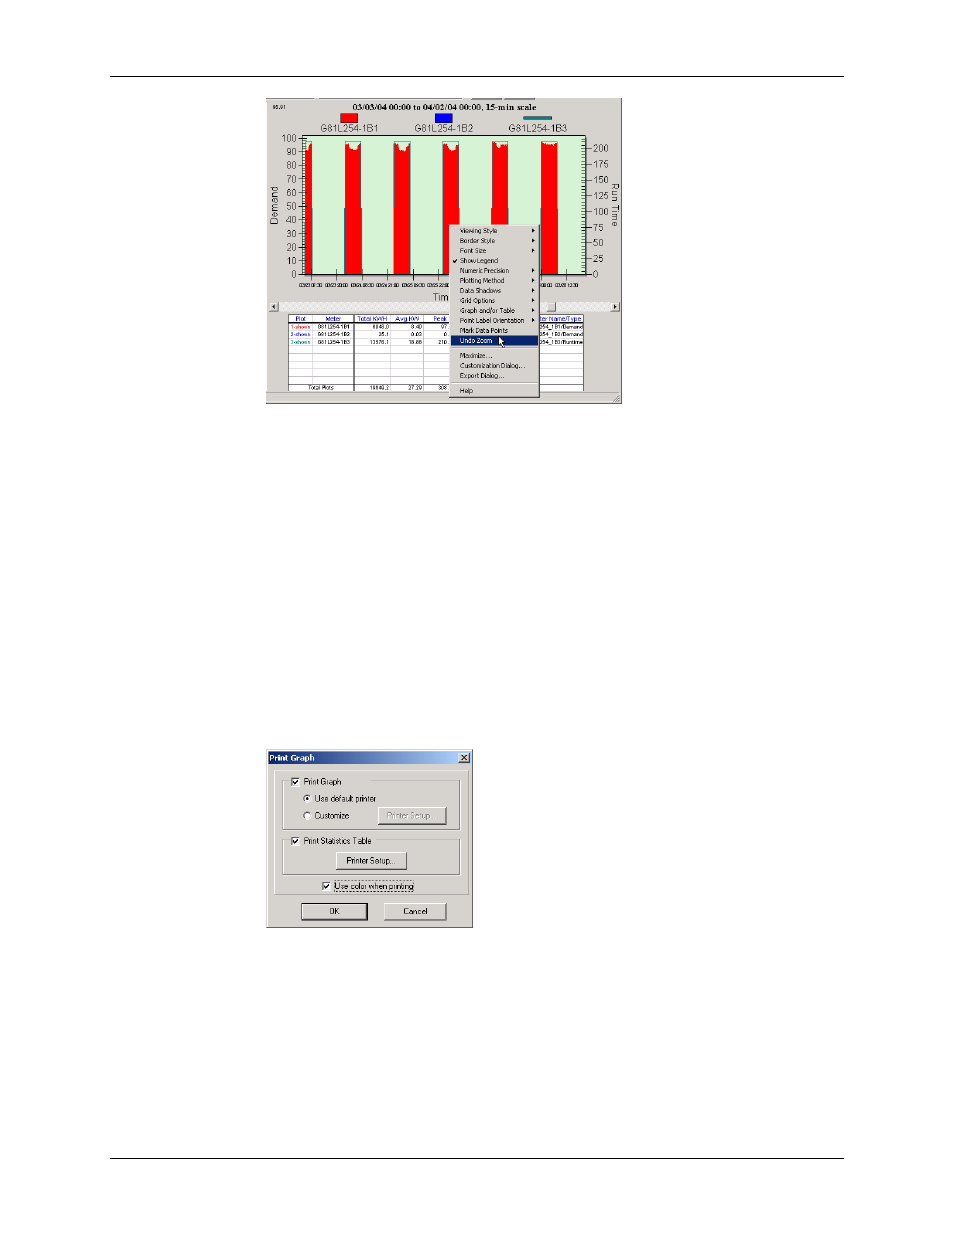
Demand Profile Graph
E-Mon Energy User Manual
16-9
E-MON
Figure 16.15 - Demand Profile Graph- Undo Zoom Feature
Other viewing options are:
Device Explorer
– Uncheck to remove Device Explorer from window view.
Statistics
– Uncheck to remove Statistics Table from window view.
Default View
– Click to change the graph view to a line graph. Note: This is the
default graph view.
Chopper View
– Click to change the graph view to a Daily Demand view based on your Time Period
selection.
Prev Locn
– Click to return to the previous location within the Device Explorer to view other meter
locations.
Next Locn
– Click to go to the next location within the Device Explorer to view other meter locations.
Printing a Graph
1
To print a graph, click and select File/Print from the drop-down menu.
2
Select Use default printer or Customize to customize the printer setup.
3
Click the
OK
button to print or the
Cancel
button to exit.
Figure 16.16 - Print Graph Dialog