E-Mon Energy Software User Manual
Page 172
Real-Time Graphs
E-Mon Energy User Manual
17-5
E-MON
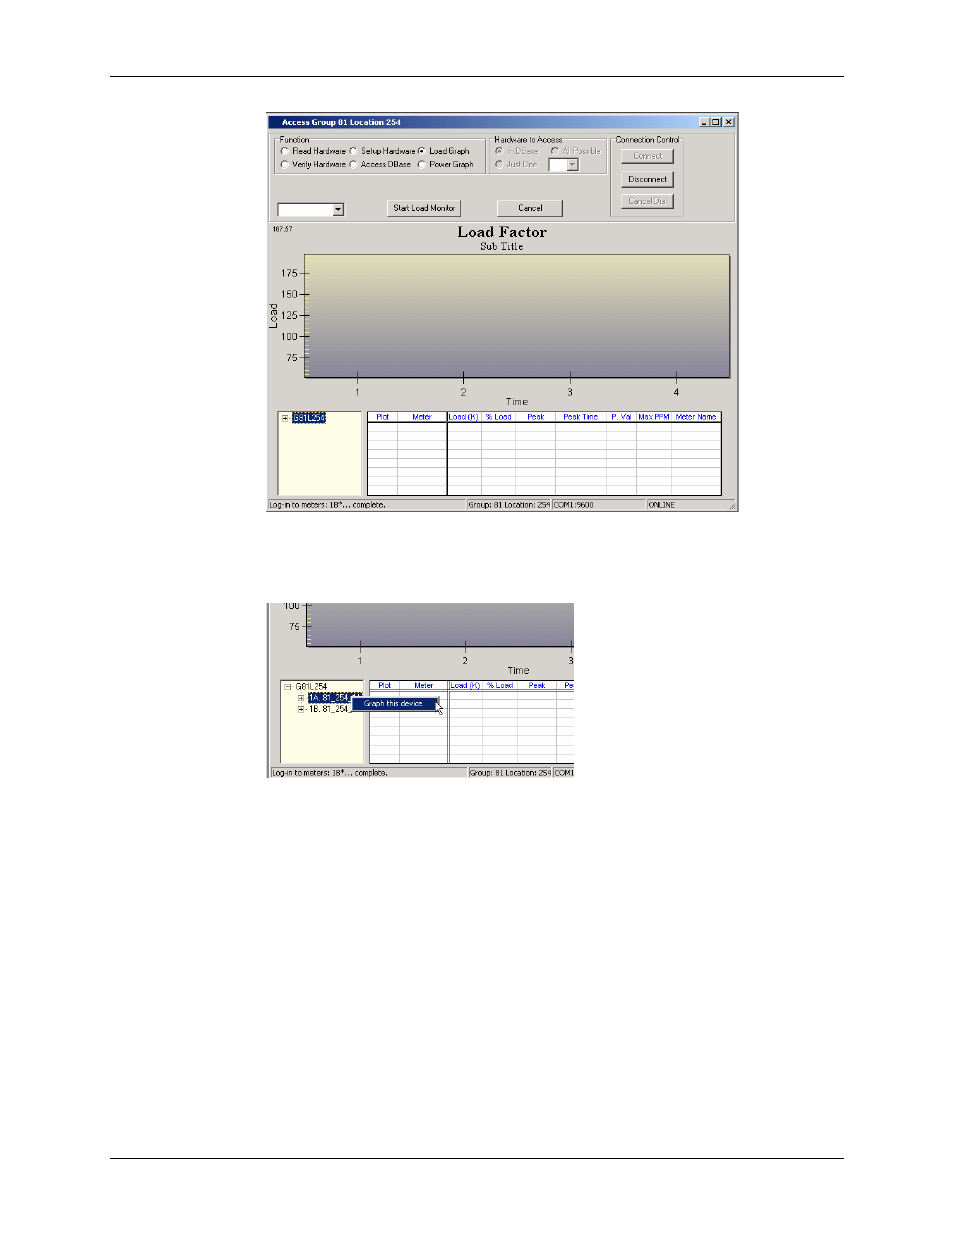
Figure 17.8 - E-Mon Energy™ Load Factor Graph – Real-Time
6
From the Device Explorer list box, drill down and right-click on the Recorder ID, then
click on Graph this Device. The Statistic Graph will populate with the meter data.
Figure 17.9 - Device Explorer - Get Device
7
Click Start Load Monitor. The Load Factor graph displays real-time load in minutes.