How is the data stored, What is the statistics table – E-Mon Energy Software User Manual
Page 157
Demand Profile Graph
E-Mon Energy User Manual
16-2
E-MON
How Is the Data Stored?
E-Mon Energy™ retrieves the interval data (demand and energy related data) from the devices and stores it in a
database file. The data is downloaded using the Access Location window from each of the devices. Once the
interval data is stored, it can be used to create load profile graphs to analyze energy usage and/or create billing
statements. The illustration below shows the interval data retrieved from the devices, stored, and viewed.
Figure 16.2 - Interval Data Retrieval process
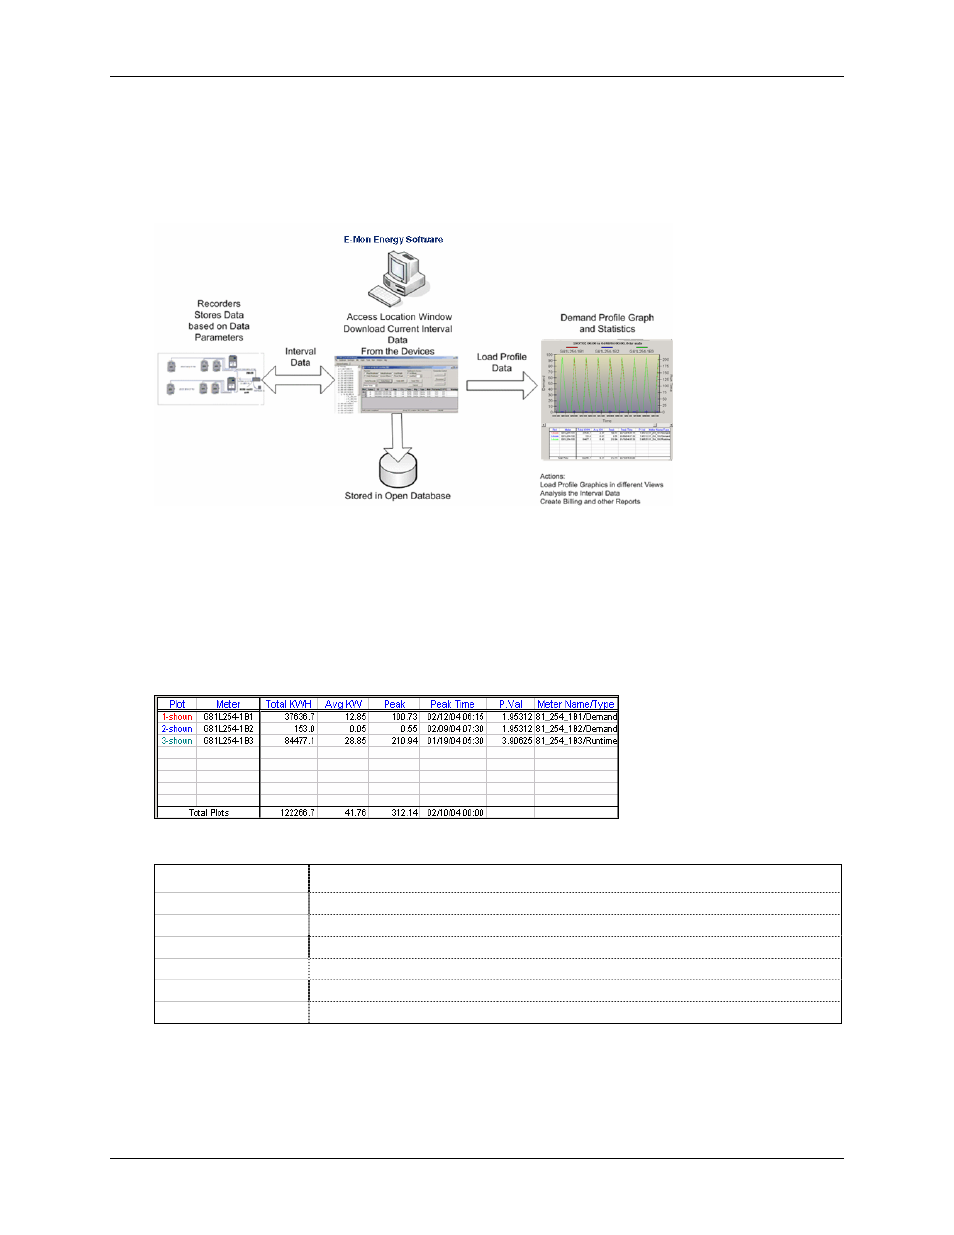
What Is the Statistics Table?
Besides using the load profile graph view, the user can analyze the statistical energy data for the time period they
select. The energy data populates onto the Statistics Table, which displays the Total Energy Usage, Average Daily
Demand, Peak Demand, and Date/Time of the peak. The table also acts as a legend for the profile graph, indicating
each meter plot in a different color. The only way to clear the table is to right click on the grid area and select “Delete
this plot” or “Delete All”. The following illustration shows a populated Statistics Table.
Figure 16.3 - Demand Statistics Table
Columns
Description
Total kWh
This column displays the Total Energy Usage (Kilo Watt Hour).
Avg. kW
This column displays the Average Daily Energy Demand.
Peak
This column displays the highest energy demand (Peak Demand).
Peak Time
This column displays the date and time of highest demand (Peak Date/Time)
P. Val
This column displays the Pulse Value, (i.e. WHrs per pulse for electricity).
Meter Name
This column displays the Meter Name that is inherited from the database.