E-Mon Energy Software User Manual
Page 166
Demand Profile Graph
E-Mon Energy User Manual
16-11
E-MON
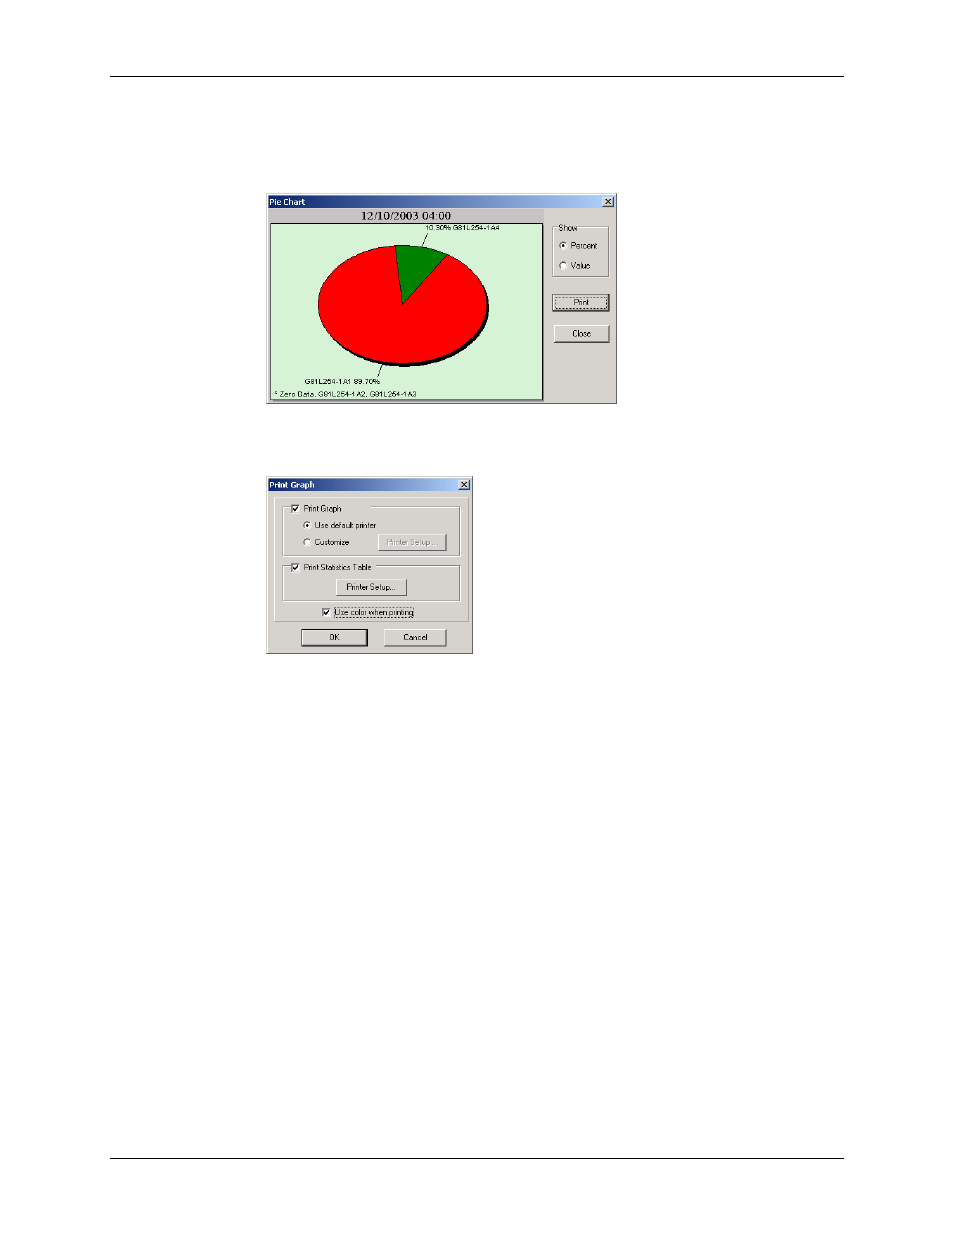
Creating a Pie Chart
1. To open a Pie Chart view from the graph, move the cursor to the area where you wish to view
the pie chart. When the cursor changes to a hand sign, click the mouse button.
Note: Select from any two viewing options: Percent or Value.
Figure 16.20 - Pie Chart
2. Click the Print
button to print the pie chart, or click the Close button to exit.
Figure 16.21 - Print Pie Chart Graph