Multi-node user counts comparison chart – H3C Technologies H3C Intelligent Management Center User Manual
Page 277
261
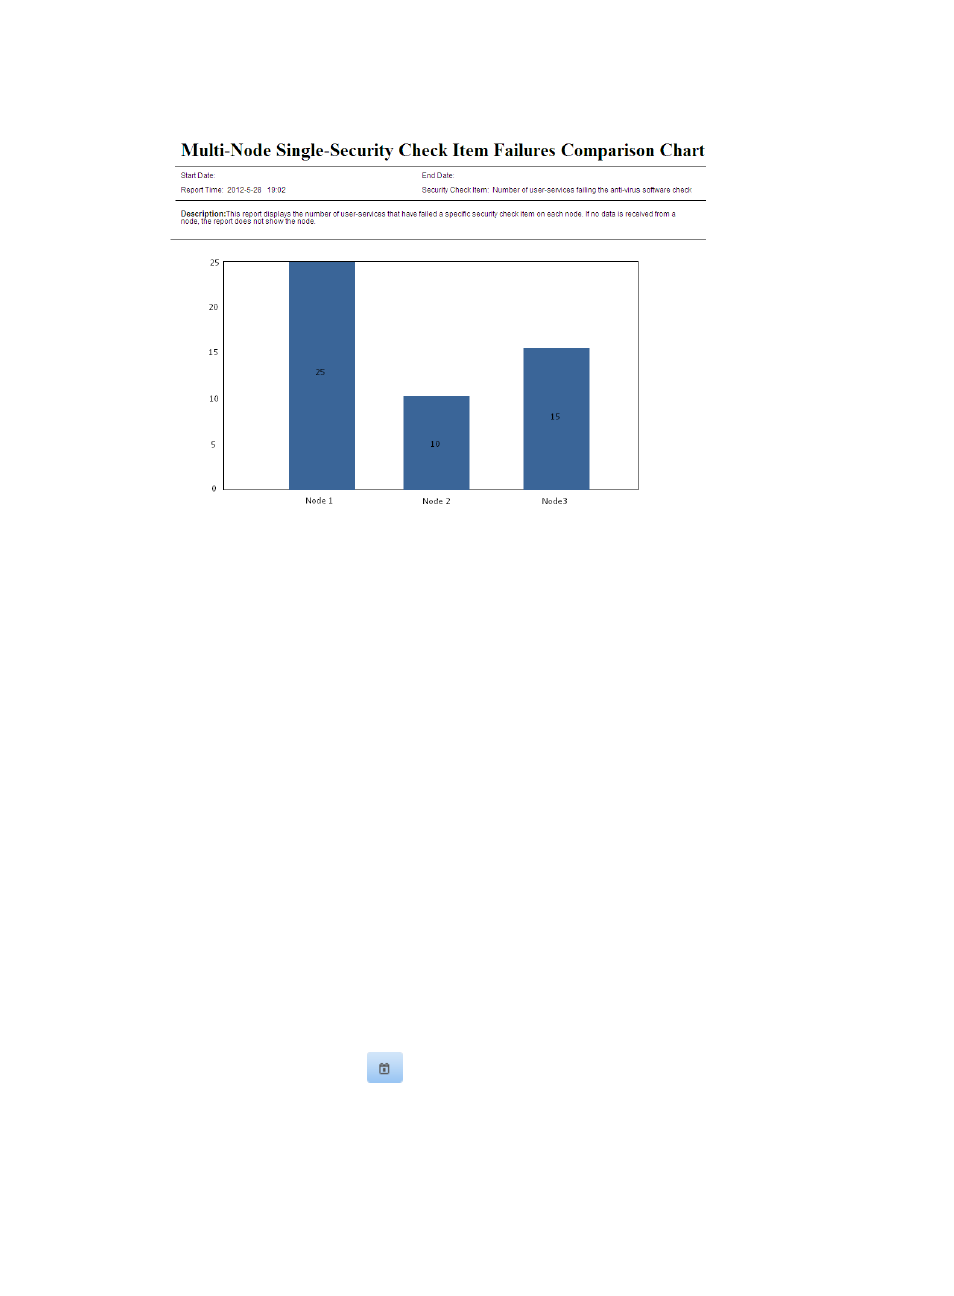
Figure 38 Multi-node single-security check item failures comparison chart
Multi-node single-security check item failures comparison chart parameters
•
Start Date—Start date for the report statistics.
•
End Date—End date for the report statistics.
•
Report Time—Time when the report was generated.
•
Security Check Item—Security check item whose statistics are collected in the report.
•
Description—A brief description of the report.
Multi-node single-security check item failures comparison chart
The chart displays the failure times of a security check item on each node during a specified time range
in a histogram.
Multi-node user counts comparison chart
This report compares the number of users of multiple EAD nodes (the current node and its child nodes) at
a specific time. The users include access users created, blacklist users, and guests. When no data is
received from a node, the report does not show the node.
To view the multi-node user counts comparison chart:
1.
Click the Report tab.
2.
Click the Multi-Node User Counts Comparison Chart link in the My Real-Time Reports [Edit Mode]
area. (Verify that this link displays [Edit Mode], as this confirms that you are in view mode.)
The Set Parameter dialog box appears.
3.
Click the Calendar icon
in the Query Time field to select the time for querying the report
statistics.
You can also enter the query time for the report statistics, in the format YYYY-MM-DD.
4.
Click the radio button to the left of delay time, and set the delay to 5 minutes or 10 minutes.