Multi-node online users comparison chart – H3C Technologies H3C Intelligent Management Center User Manual
Page 272
256
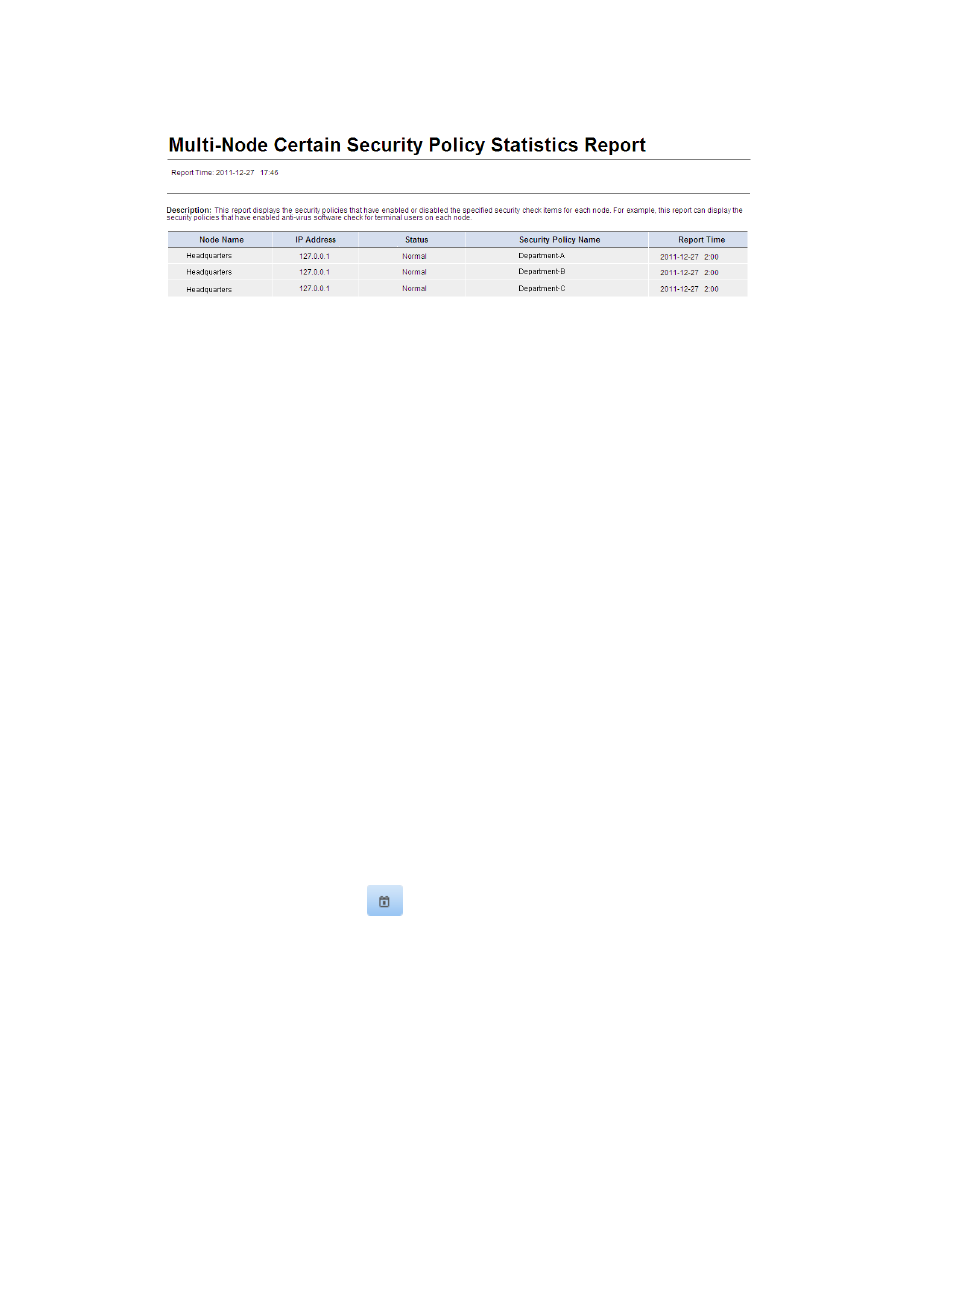
Figure 35 Multi-node certain security policy statistics report
Multi-node certain security policy statistics report parameters
•
Report Time—Time when the report was generated.
•
Description—A brief description of the report.
Multi-node certain security policy statistics report fields
•
Node Name—Name of the current node or child node.
•
IP Address—IP address of the current node or child node.
•
Status—Status of the current node or child node.
•
Security Policy Name—Security policy matching the filtering conditions.
•
Report Time—Time when the node reported the statistics.
Multi-node online users comparison chart
This report compares the number of online users of multiple EAD nodes (the current node and its child
nodes) at a specific time. Online users are categorized as secure online users, insecure online users, and
unknown online users. The total number of online users is the sum of the number of users of each type.
When no data is received from a node, the report does not show the node.
To view the multi-node online users comparison chart:
1.
Click the Report tab.
2.
Click the Multi-Node Online Users Comparison Chart link in the My Real-Time Reports [Edit Mode]
area. (Verify that this link displays [Edit Mode], as this confirms that you are in view mode.)
The Set Parameter dialog box appears.
3.
Click the Calendar icon
in the Query Time field to select the time for querying the report
statistics.
You can also enter the query time in the format YYYY-MM-DD hh:mm:ss.
4.
Click the radio button to the left of delay time, and set the delay to 5 minutes or 10 minutes.
The system collects the number of online users for the current node and its child nodes and
generates a chart to compare the online users of multiple nodes during the statistics time. The
statistics time is calculated as follows: the system deducts the delay from the query time, and then
rounds the result down to a multiple of half an hour. For example, when the query time is
2011-07-01 08:07:00 and the delay is 5 minutes, the report collects the statistics of 2011-07-01
08:00:00. When you modify the delay to 10 minutes, the system collects the statistics of
2011-07-01 07:30:00.
5.
Select the nodes that you want to compare.