All-node online users 24-hour trend graph – H3C Technologies H3C Intelligent Management Center User Manual
Page 259
243
Real-time reports
Service component
OS Version Report
DAM
Safe Log Gather Statistic Report
User Security Policy
Single-Node Online Users 24-Hour Trend Graph
User Security Policy
Single-Node Security Check Failure Report
User Security Policy
Software Installation Report
DAM
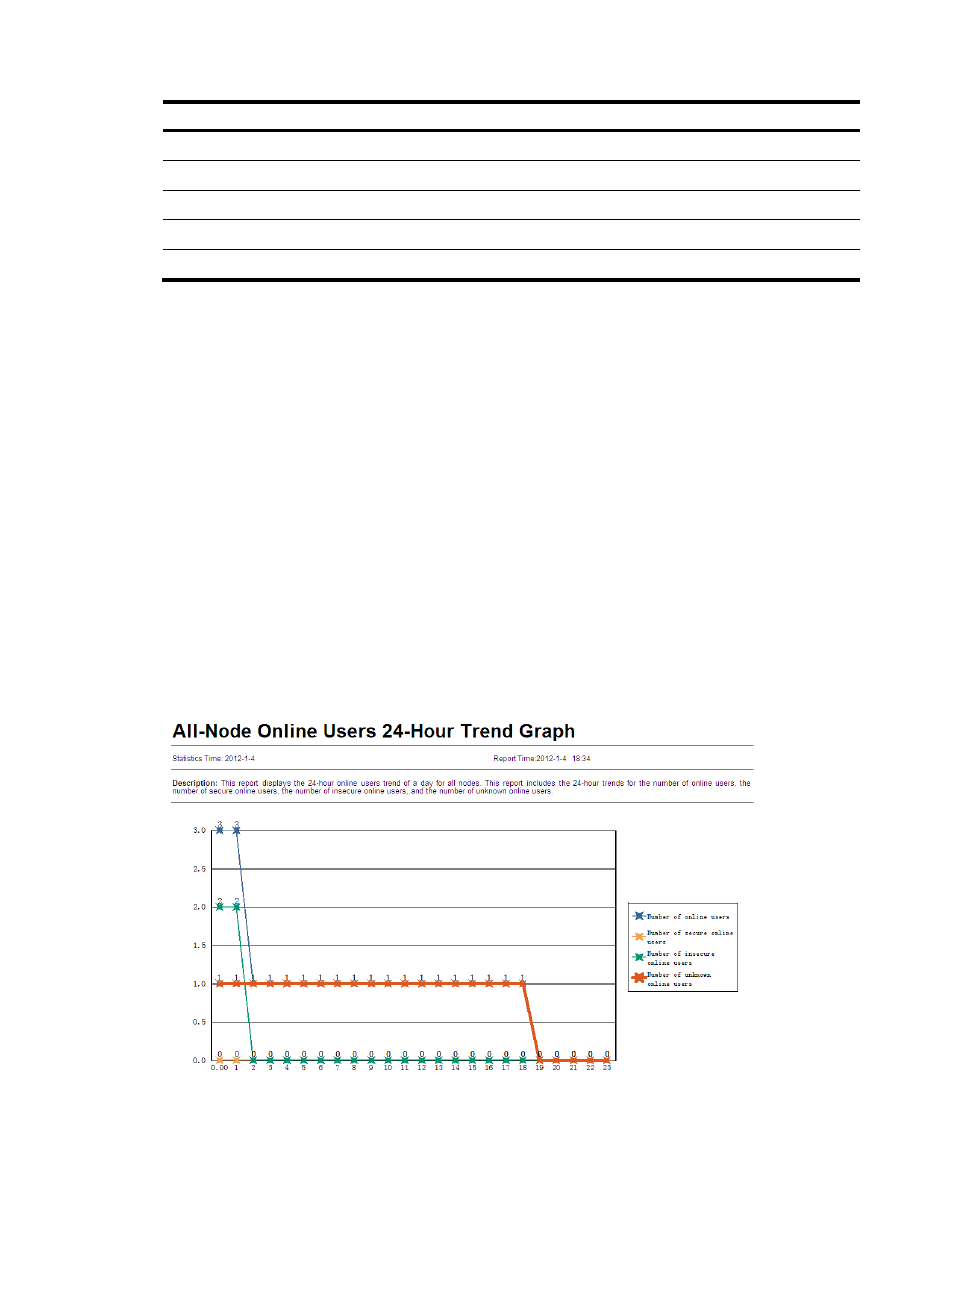
All-node online users 24-hour trend graph
This report collects statistics about the number of online users throughout a 24 hour period, for the current
node and all its child nodes. Online users are categorized as secure online users, insecure online users,
and unknown online users.
To view the all-node online users 24-hour trend graph:
1.
Click the Report tab.
2.
Click the All-Node Online Users 24-Hour Trend Graph link in the My Real-Time Reports [Edit Mode]
area. (Verify that this link displays [Edit Mode], as this confirms that you are in view mode.)
The Set Parameter dialog box appears.
3.
Click the Query Time field to select the date for querying the report statistics.
4.
Click OK.
The all-node online users 24-hour trend graph appears in an Intelligent Analysis Report Viewer
page, as shown in
Figure 22 All-node online users 24-hour trend graph
All-node online users 24-hour trend graph parameters
•
Statistics Time—Date when statistics were collected by the report.