2 histogram graphs, Histogram graphs -4 – Bio-Rad EXQuest Spot Cutter User Manual
Page 339
PDQuest User Guide
11-4
Fig. 11-4. Colorized graphs showing replicate group by individual and group
To delete a configuration, highlight the item you wish to delete and click Delete.
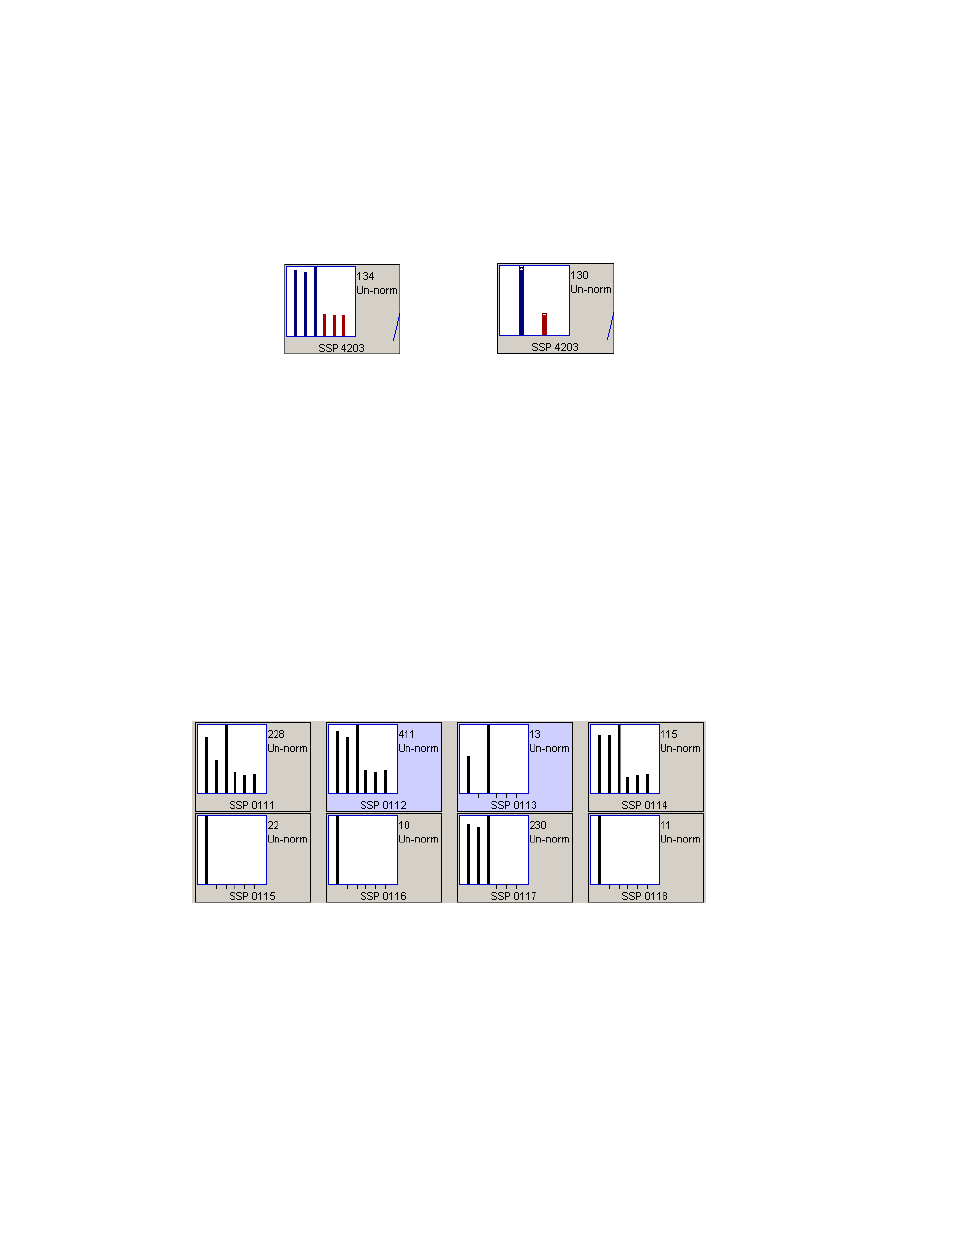
11.2 Histogram Graphs
Histogram graphs can be used to quickly compare a spot’s quantity in each member of
a MatchSet. A brief look at a histogram can give you a sense of the general trends in
spot quantity.
Histograms are also useful as tools for detecting problems such as spots that are not
matched and spots whose quantitation is suspiciously off the average. Reviewing the
histograms of spots in an Analysis Set is a quick and easy way to confirm that the
members of the Analysis Set meet the criteria that was specified when the set was
created.
Fig. 11-5. Sample Histogram graph.
Individual
Group