Bio-Rad EXQuest Spot Cutter User Manual
Page 203
PDQuest User Guide
6-12
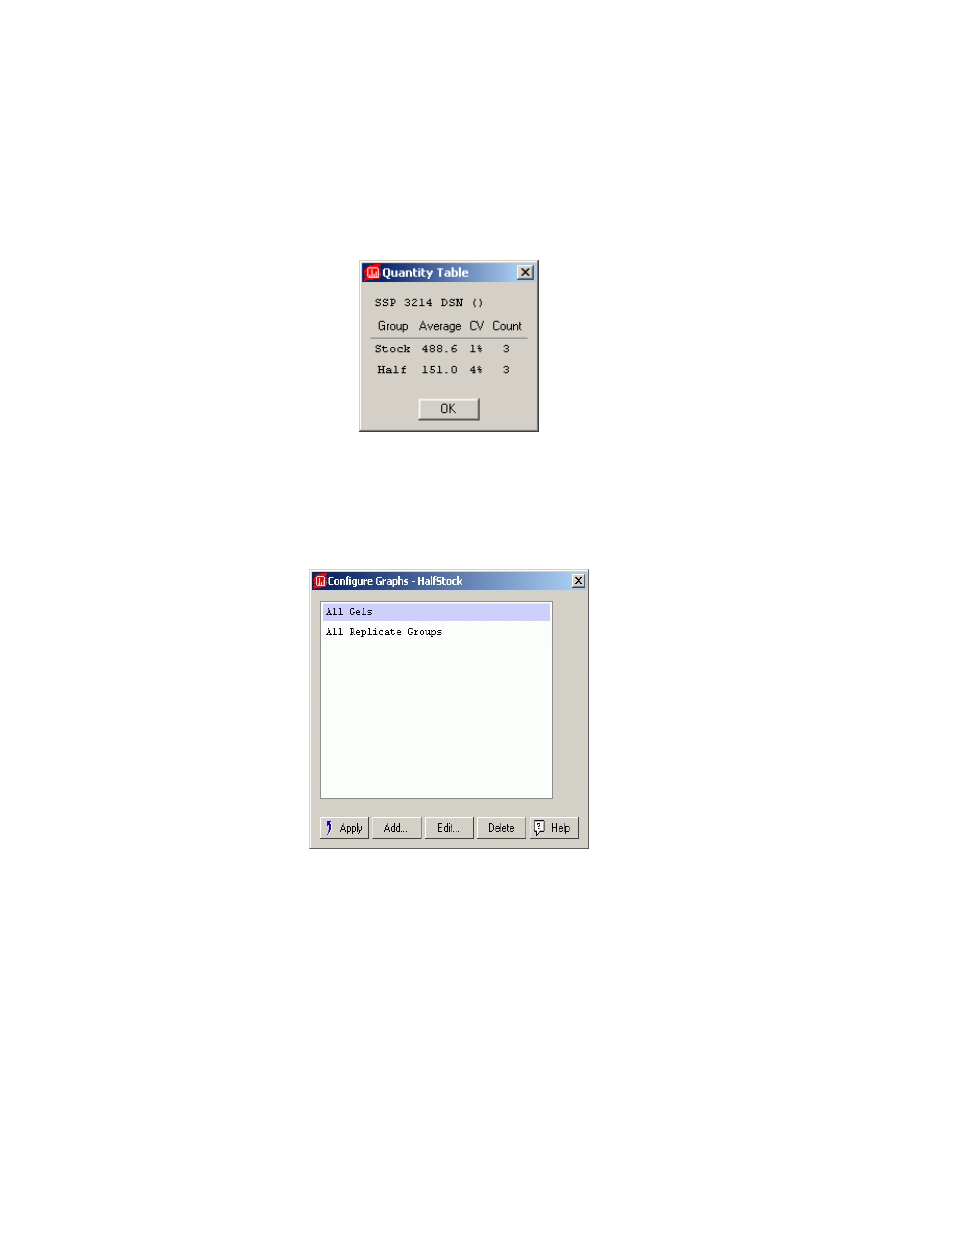
Fig. 6-9. Quantitation table displaying replicate group quantitation.
Click the spot whose quantitation you want to see. If you select the All Replicate
Group as your graph configuration (located in the Report menu), the average value of
that spot’s quantitation will be displayed.
Fig. 6-10. Select graph configuration.
This manual is related to the following products:
See also other documents in the category Bio-Rad Accessories for water:
- TransFectin™ Lipid Reagent (2 pages)
- Gene Pulser MXcell™ Electroporation System (66 pages)
- Gene Pulser MXcell™ Electroporation System (19 pages)
- Gene Pulser Xcell™ Electroporation Systems (83 pages)
- Gene Pulser® Electroporation Buffer (2 pages)
- MicroPulser™ Electroporator (31 pages)
- Helios® Gene Gun System (52 pages)
- PDS-1000 / He™ and Hepta™ Systems (51 pages)
- TGX™ FastCast™ Acrylamide Solutions (2 pages)
- Criterion™ TGX Stain-Free™ Precast Gels (16 pages)
- Gel Doc™ EZ System (22 pages)
- Criterion Stain Free™ Tris-HCl Gels (96 pages)
- Image Lab™ Software (212 pages)
- Mini-PROTEAN® TGX™ Precast Gels (52 pages)
- ChemiDoc™ XRS+ System (4 pages)
- ChemiDoc™ XRS+ System (50 pages)
- GS-800™ Calibrated Densitometer (444 pages)
- ChemiDoc™ MP System (8 pages)
- Image Lab™ Software (236 pages)
- ChemiDoc™ XRS+ System (42 pages)
- Criterion™ TGX™ Precast Gels (60 pages)
- Criterion™ Cell (13 pages)
- Image Lab™ Software (260 pages)
- Criterion™ XT Bis-Tris Precast Gels (26 pages)
- 2-D Electrophoresis Workflow (14 pages)
- 2-D Electrophoresis Workflow (22 pages)
- 2-D Electrophoresis Workflow (20 pages)
- PROTEAN® i12™ IEF System (4 pages)
- ReadyPrep™ 2-D Starter Kit (28 pages)
- EXQuest Spot Cutter (81 pages)
- Fluorescent Protein Stains (27 pages)
- Ready Gel® Zymogram Precast Gels (46 pages)
- Mini-PROTEAN 2-D Electrophoresis Cell (44 pages)
- Precision Plus Protein™ Prestained Standards (3 pages)
- Precision Plus Protein™ Unstained Standards (16 pages)
- Prestained SDS-PAGE Standards (3 pages)
- Silver Stains (20 pages)
- Unstained SDS-PAGE Standards (3 pages)
- Biotinylated Standards (3 pages)
- Biotinylated Standards (11 pages)
- IEF and 2-D Standards (3 pages)
- Mini-PROTEAN 2-D Electrophoresis Cell (20 pages)
- PROTEAN® Plus Hinged Spacer Plates and Combs (21 pages)
- Mini-PROTEAN® Tetra Handcast Systems (10 pages)
- Mini-PROTEAN 3 Multi-Casting Chamber (10 pages)