Overview reports – Lincoln Electric IM8000 CHECKPOINT User Manual
Page 94
Chapter 7. Summary Tab – Container Level
Overview Reports
7.6 CheckPoint™
User
Manual
IM8000
Overview Reports
The Overview reports provide you with graphical representations of the data captured by the Welding
Power Sources in the Container you select in the Asset Tree. You have the option to quickly view Today’s
data, data from the last seven days or customize the date range and shift you want to see.
Figure 7.3 Overview Reports
For each of the time periods, most of the reports are the same, just a different date/time range; however,
with the Today display, you have additional graphs: Lowest Consumable Time Remaining, Avg. WeldScore™
Top 10 and Avg. WeldScore™ Bottom 10.
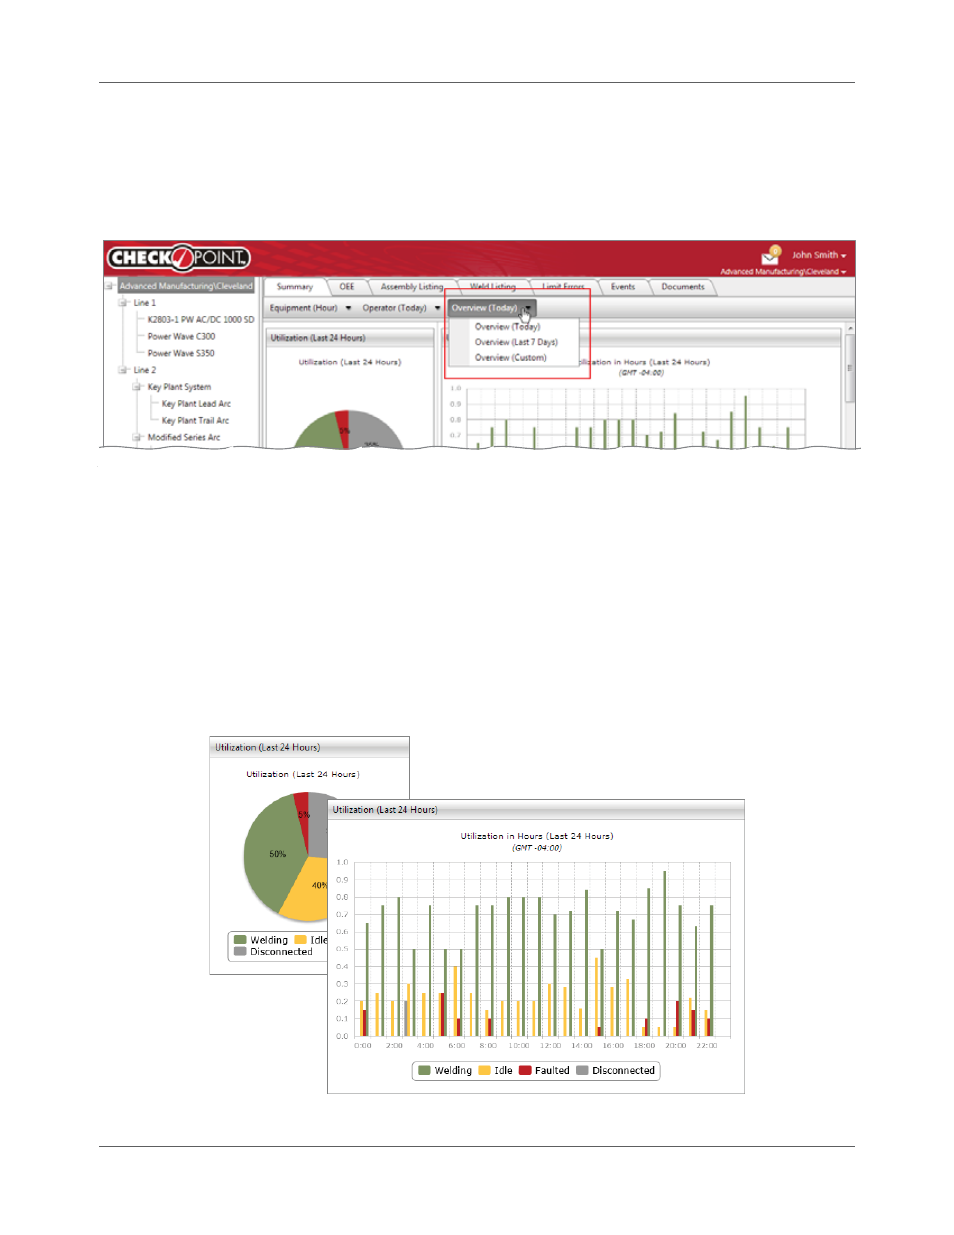
Utilization
The Utilization pie chart reflects the averaged time that the welders in the Container were in use (or not in
use) over the time period you select (i.e., Today, Last 7 Days or Custom). The bar graph widget breaks that
information down into all year, by months, days, hours or shifts (depending on your time period choice or
custom selection) and displays how much total time the Welding Power Sources in the selected Container
were in each of the statuses: Welding, Idle, Faulted and Disconnected.
Figure 7.4 Utilization