Lincoln Electric IM8000 CHECKPOINT User Manual
Page 109
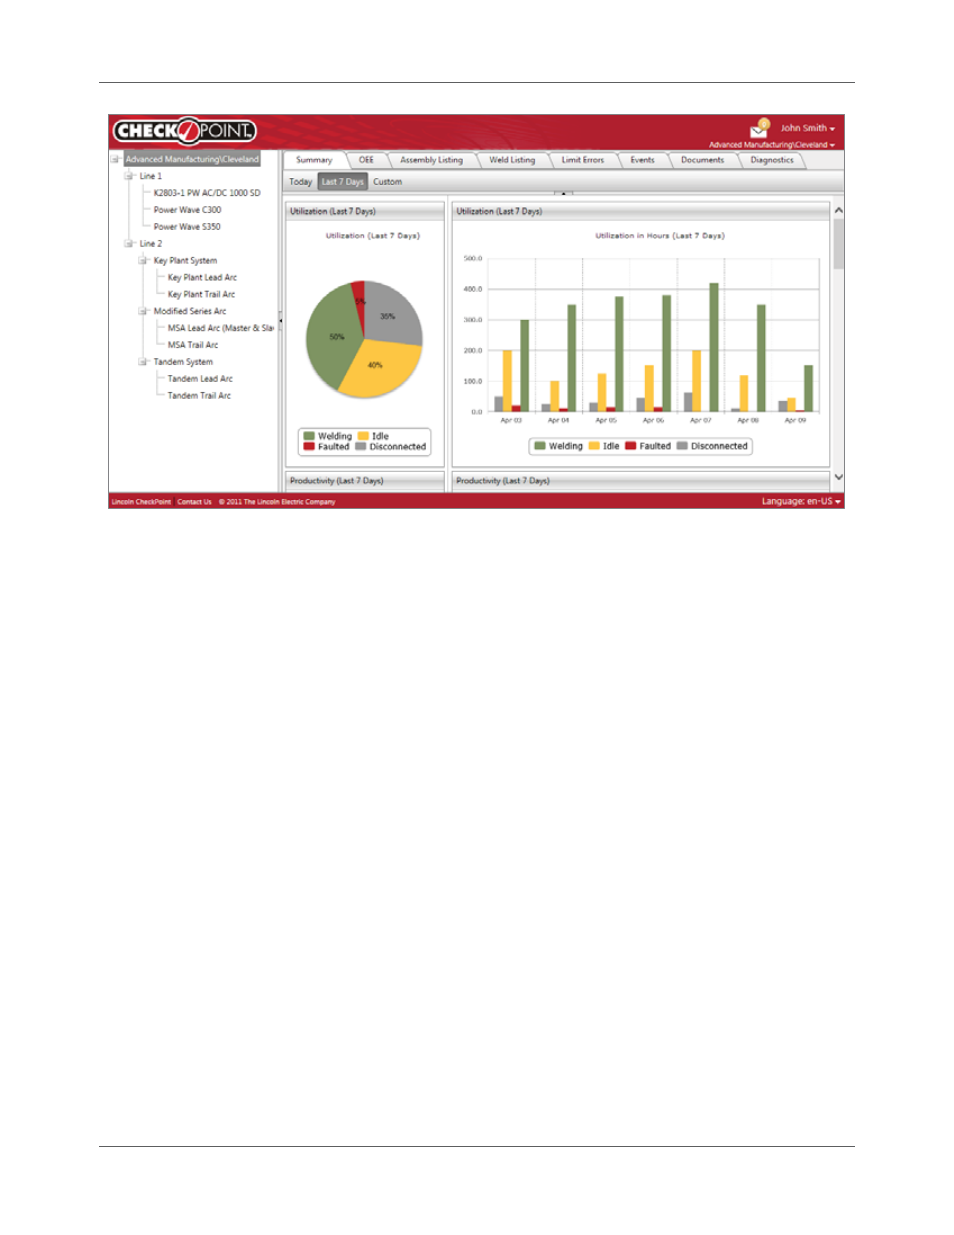
Last 7 Days
Chapter 8. Summary Tab – Power Source Level
IM8000 CheckPoint™
User
Manual
8.11
Figure 8.12 Utilization (Last 7 Days) Widgets
Productivity (Last 7 Days)
The Productivity (Last 7 Days) widgets provide an overview of the number of welds made in the last seven
days (Figure 8.13). The graphs breaks them into categories:
Without Limit: CheckPoint™ includes in this category any welds performed over the last seven
days that did not have WeldScore™ or other limit enabled when it was performed.
Out of Limit: Of the total number of welds performed over the last seven days, this percentage
represents the number of those welds that went outside of the limits set for the weld.
In Limit: Of the total number of welds performed over the last seven days, this percentage
represents the number of those welds that were within the limits set for the weld.
The pie chart breaks down the number of welds made over the last seven days and displays the percentage
of total welds in each category. The bar graph shows the total number of welds performed over the last
seven days, as well as how many of those welds were within limits or out of limits.