Lincoln Electric IM8000 CHECKPOINT User Manual
Page 116
Chapter 9. Overall Equipment Efficiency (OEE)
OEE Tab
9.2 CheckPoint™
User
Manual
IM8000
TIP |
When you select a single Welding Power Source,
CheckPoint™ also provides you with a detailed Availability
graph. Simply click the Availability button to display the
graph. Click the Criteria link to fine tune the information.
The same graph displays on the Summary tab. For more
details on this graph, please see page 8.3.
Today Reports
At the Container level, the Today report lists the OEE factors for each of the Welding Power Sources within
the Container. At the Welding Power Source level, the Today report displays the OEE data down to the
hour of each shift over the last 24 hours for the selected power source. Details on each of the calculations
begin on page 9.5.
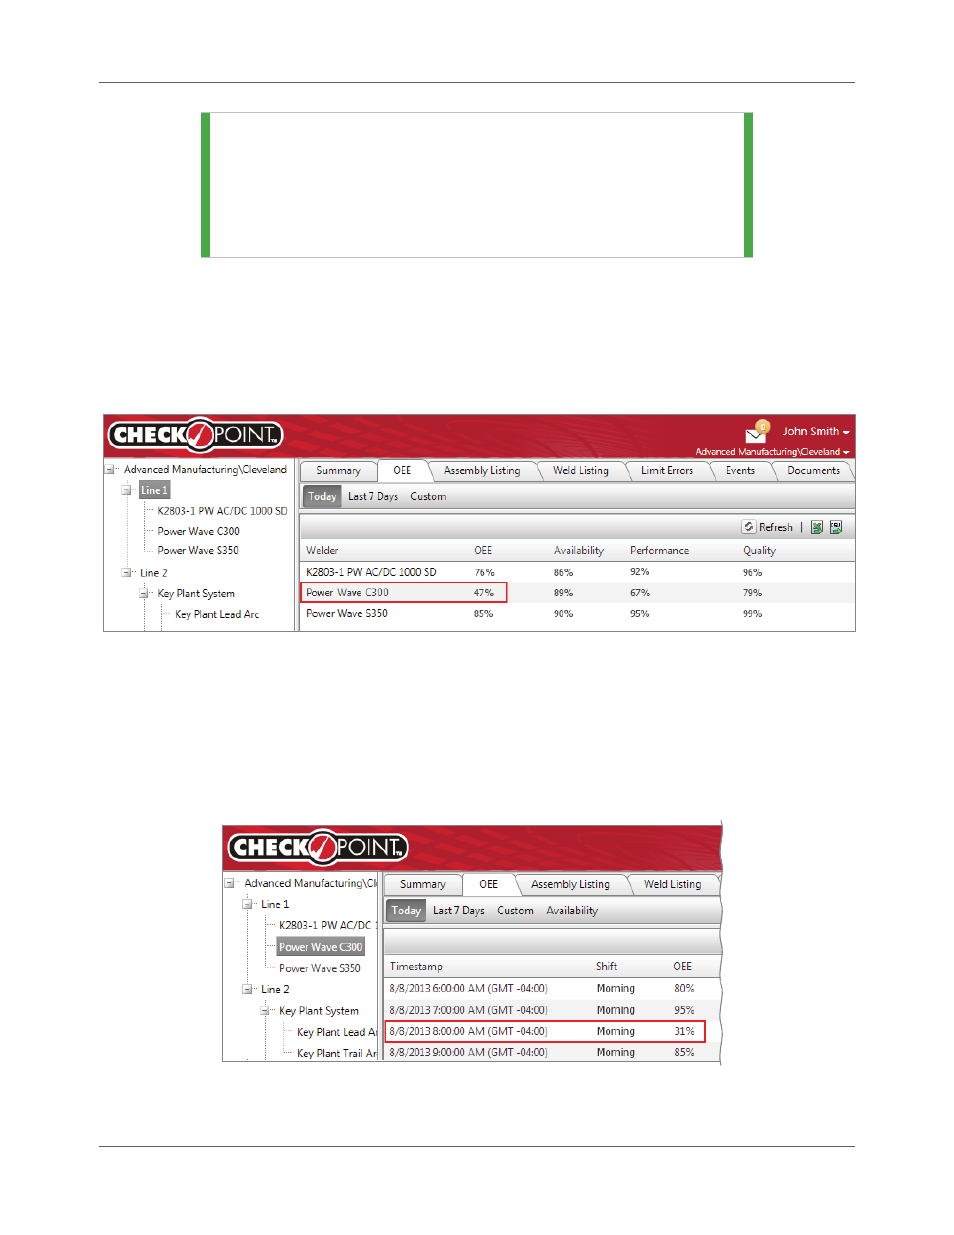
Figure 9.2 Today OEE Reports – Container Level
For example, John at Advanced Manufacturing has been keeping an eye on the efficiency of one of his
production lines. He wants to see how the line did over the last 24 hours. He clicks the Line 1 Container
and clicks Today on the OEE tab (Figure 9.2). Everything looks great except for one machine. Now he can
click that Welding Power Source in the Asset Tree and view data for every hour of all the shifts that
occurred during the last 24 hours. He pinpoints a problem that occurred at 8:00 AM (Figure 9.3) and can
now troubleshoot the issue.
Figure 9.3 Today OEE Reports – Welding Power Source Level