Lincoln Electric IM8000 CHECKPOINT User Manual
Page 105
Today
Chapter 8. Summary Tab – Power Source Level
IM8000 CheckPoint™
User
Manual
8.7
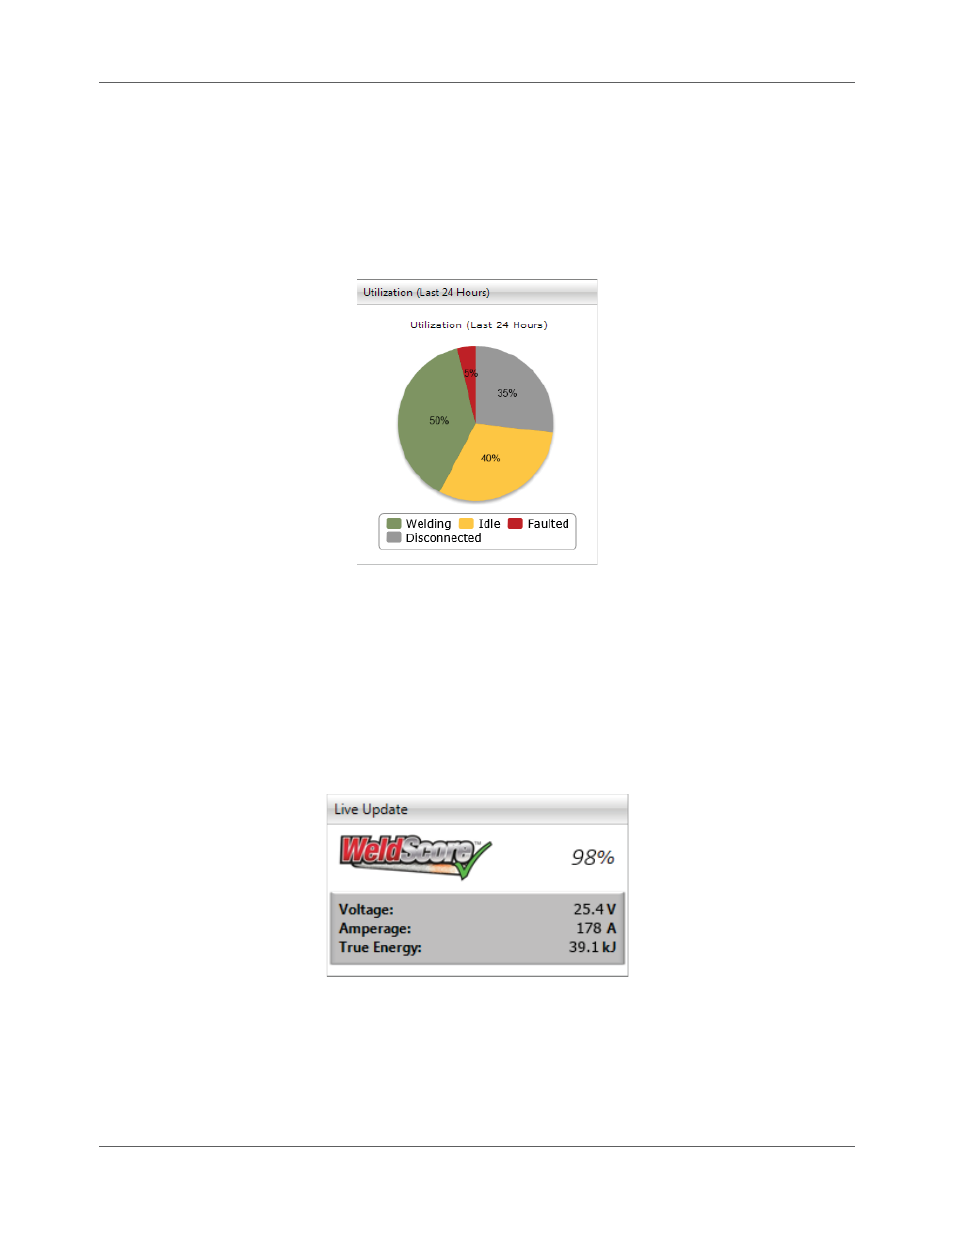
Utilization (Last 24 Hours)
The Utilization (Last 24 Hours) pie chart shows the total arc-on time compared to idle, disconnected and
faulted time (Figure 8.7). It reflects the amount of time that the Welding Power Source was in use (or not
in use) over the last 24 hours. The graph breaks that information down into the percentage of the last 24
hours and displays how much of the total time the Welding Power Sources spent in each of the statuses:
Welding, Idle, Faulted and Disconnected. This is a rolling 24-hour graph.
Figure 8.7 Utilization (Last 24 Hours)
WeldScore™ Live Update
When you select a single Welding Power Source in the Asset Tree, the Live Update widget displays the
WeldScore™ for the current weld being performed by that power source (Figure 8.8). This widget also
displays the average Voltage, Amperage and True Energy™ being put into the active weld. WeldScore™
compares the current weld to the baseline weld it was taught for the Weld Profile used. Please refer to the
Power Wave® Manager User Manual for more information on training the system for a Weld Profile. Refer
to page 1.4 for more in-depth information about WeldScore™.
Figure 8.8 WeldScore™ Live Update