Lincoln Electric IM8000 CHECKPOINT User Manual
Page 110
Chapter 8. Summary Tab – Power Source Level
Last 7 Days
8.12 CheckPoint™
User
Manual IM8000
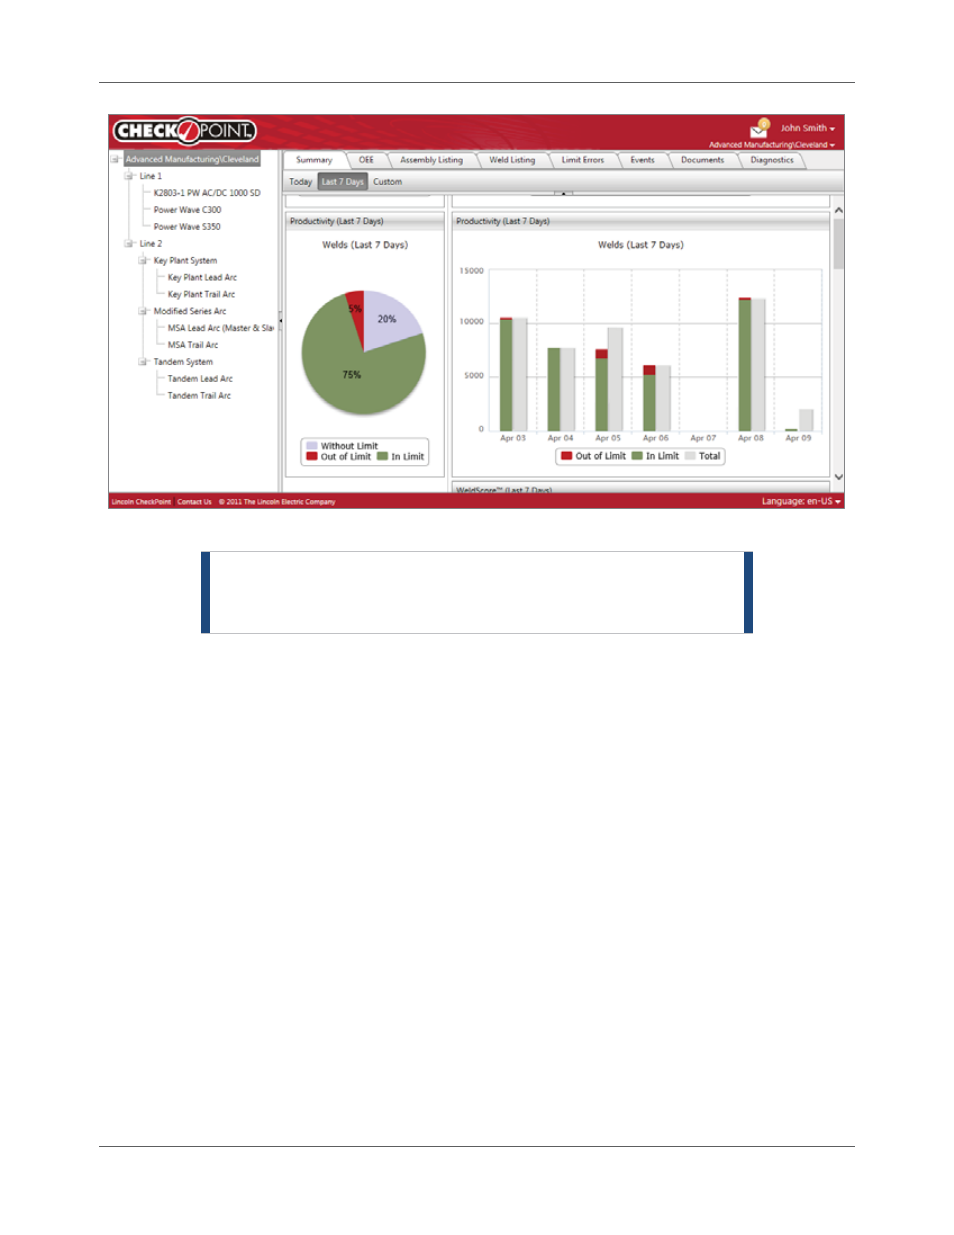
Figure 8.13 Productivity (Last 7 Days) Widgets
NOTE |
If no Weld Profile was used or there were no limits set in
the profile, CheckPoint™ includes that weld or welds in the
Without Limit category on the pie chart.
For example, Advanced Manufacturing performed 45,000 welds over the course of seven days. Of those
45,000 welds, 9000 had no limits set, 2250 were outside the limits set for them and 33,750 were within
limits. Therefore, the Productivity pie chart displays a slice for 20% Without Limit, 5% Out of Limit, and 75%
In Limit.
WeldScore™ (Last 7 Days)
The WeldScore (Last 7 Days) graph (Figure 8.14) displays the number of welds that were scored on the
Welding Power Source (meaning that a Weld Profile was selected when creating the weld) over the last
seven days and the number of welds not scored (meaning that a Weld Profile was not selected when
creating the weld). The graph also marks the average WeldScore™ per day on the Welding Power Source.
- Invertec V310-T DC (2 pages)
- VANTAGE 500 (CE) 11575 (50 pages)
- INVERTEC V350-PRO SVM152-A (155 pages)
- IMVERTEC V160-T (36 pages)
- IDEALARC CV-300 (112 pages)
- INVERTEC POWER WAVE 450 SVM112-B (293 pages)
- AUTO-DARKENING HELMET IM10001 (12 pages)
- IM10111 IDEALARC R3R-500-I (28 pages)
- IM10110 IDEALARC R3R-400 (25 pages)
- IM10051 INVERTEC V311-T AC_DC (38 pages)
- IM10059 SQUARE WAVE TIG 175 (30 pages)
- IM10096 POWER MIG 256 (37 pages)
- IM10096 POWER MIG 256 (38 pages)
- IM10105 POWER MIG 350MP (47 pages)
- IM10115 FLEXTEC 650 (42 pages)
- IM10132 FLEXTEC 650 (36 pages)
- IM10132 FLEXTEC 650 (56 pages)
- IM10018 IDEALARC DC-600 VRD (55 pages)
- IM10107 IDEALARC DC-400 (40 pages)
- IM10062 FLEXTEC 450 (72 pages)
- IM10091 FLEXTEC 450 CE (40 pages)
- IM10094 RED-D-ARC FX450 (31 pages)
- IM10157 12_24V 10A Auto HF Household Charger (16 pages)
- IM10139 JUMP STARTER (12 pages)
- IM10149 POWER WAVE ADVANCED MODULE (46 pages)
- IM10102 AIR VANTAGE 650 (60 pages)
- IM10103 AIR VANTAGE 700 (AU) (57 pages)
- IM10065 AIR VANTAGE 500 CUMMINS (54 pages)
- IM10066 AIR VANTAGE 500 (AU) (56 pages)
- IM10041 VANTAGE 500 CUMMINS (56 pages)
- IM10128 AIR VANTAGE 500 KUBOTA (AU) (56 pages)
- IM10090 ARC TRACKER (48 pages)
- IM10147 AUTO-DARKENING HELMET (12 pages)
- IM10087 AutoDrive 19 CONTROLLER (28 pages)
- IM10125 AutoDrive 19 TANDEM (34 pages)
- IM10069 AutoDrive 4R100 (32 pages)
- IM10145 AUTOPRO 20 (24 pages)
- IM10025 BIG RED 500 (40 pages)
- IM10019 BIG RED 600 (41 pages)
- IM10005 BULLDOG 140 (46 pages)
- IM10074 BULLDOG 5500 (56 pages)
- IM10067 CENTURY AC120 (20 pages)
- IM10109 CIRCULATOR (33 pages)
- IM10109 CIRCULATOR (36 pages)
- IM10153 CLASSIC 300 HE (60 pages)