Yokogawa DAQWORX User Manual
Page 87

5-4
IM WX13-01E
Data Overview
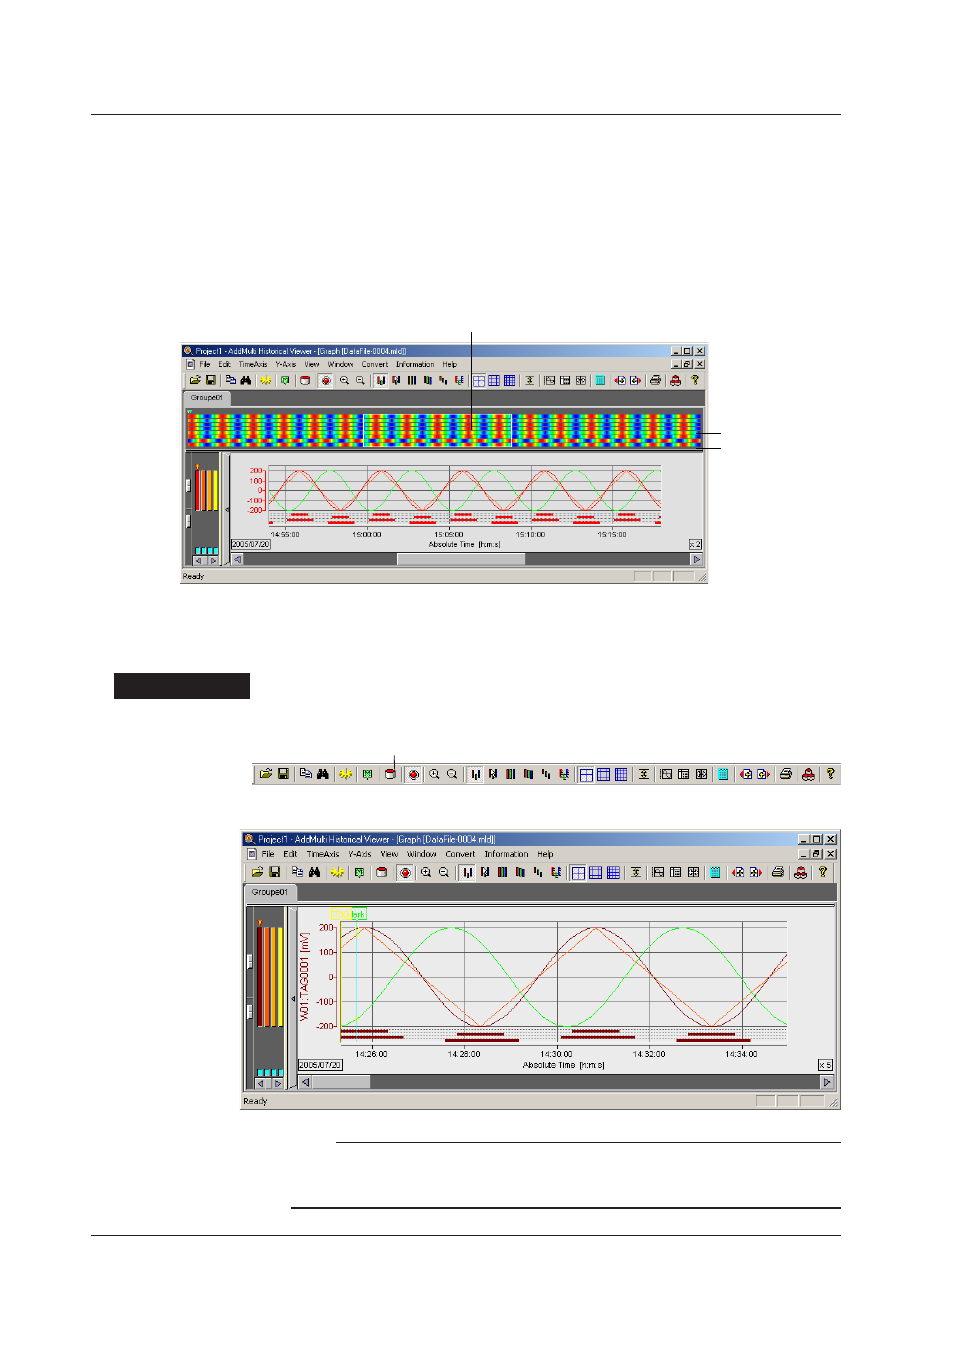
When set to waveform display, dragging the Overview spreader downward shows the
Data Overview.
The Data Overview displays the measured data by assigning the following 50 colors in order.
Blue (minimum display scale), light blue, green, yellow, red (maximum display
scale).
The waveforms in the section enclosed in the white frame on the Data Overview are
displayed.
Overview spreader
Data overview
The parts enclosed in the white frame are displayed as waveforms.
Drag the frame to move the waveform display range.
Displaying the Waveforms That Are Currently Being Logged
You can display the data that is currently being logged. This operation is possible only
when Historical Viewer is started from the Launcher.
Procedure
1.
Click Current Data on the toolbar or choose Current Data from the View menu.
Current Data
The data file currently being logged is displayed.
Note
• Each time you click Current Data, the logging data up to that point is redisplayed.
• Do not display data being logged when starting the Historical Viewer from the PC's Start
menu. Operation cannot be guaranteed. Data errors may occur.
5.1 Displaying Waveforms on Historical Viewer
