Index – Yokogawa DAQWORX User Manual
Page 86
5-3
IM WX13-01E
Displaying Logged Data (Historical V
iewer)
1
2
3
4
5
Index
6
3.
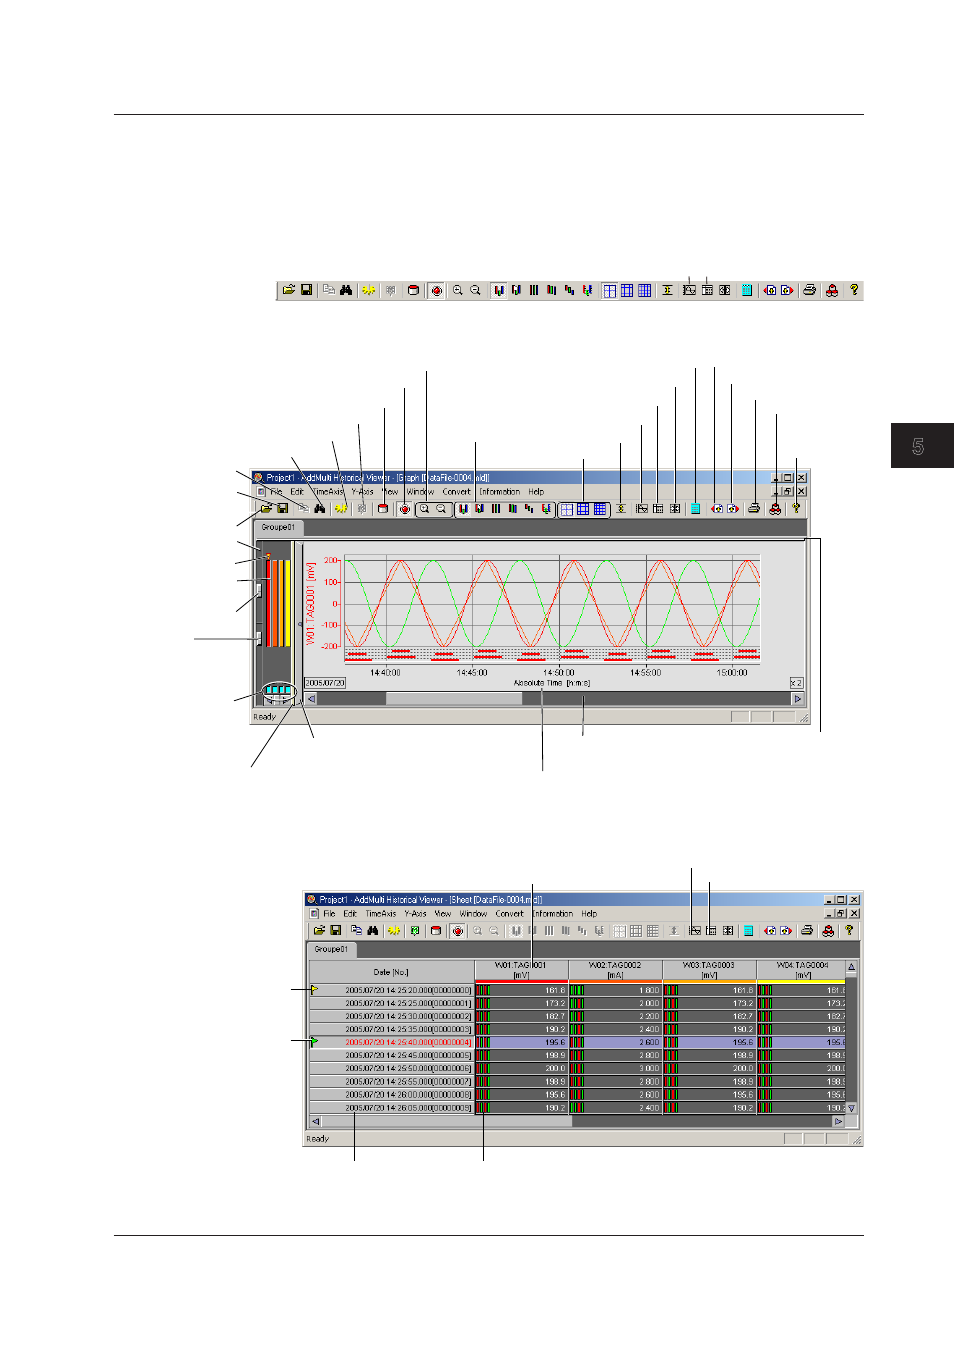
Carry out the following procedure to switch between waveform display and
numeric display.
• Click Waveform Display on the toolbar or choose Window > Waveform
Display from the menu bar.
• Click Digital Value Display on the toolbar or choose Window > Digital Value
Display from the menu bar.
Graph Sheet
Waveform Display Screen
Zoom In or Zoom Out of the time axis
Absolute or relative time
Waveform display
ON/OFF
Zone bar
Active waveform
mark
Alarm
General Display Settings
Copy
Drag this bar to widen or
narrow the waveform display area.
Click this bar to show or hide
the display zone display.
Brightness
adjustment knob
of the waveform
display area
Grid brightness
adjustment knob
Zone display area
Open
Save Display
Setting
Append Mark
Current data
Waveform display zone
Clip
Graph (waveform display)
Sheet (numeric display)
Control (Display cursor's value)
Statistics
About
Historical
Viewer
Launcher
Search
Overview spreader
Link previous file
Link next file
Alarm indication
(from the top: level 1, 2, 3, and 4)
Switch the grid density
Digital value display screen
Sheet (numeric display)
Graph (waveform display)
Trigger mark
Alarm indication (from the left: level 1, 2, 3, and 4)
Channel No., tag No., or tag comment
Append mark
Absolute/Relative time
5.1 Displaying Waveforms on Historical Viewer