Caution, 2 time axis of trend graph – Yokogawa Multi Channel Oxygen Analyzer System ZR22/AV550G User Manual
Page 169
IM 11M12D01-01E
10-7
10. Other Functions
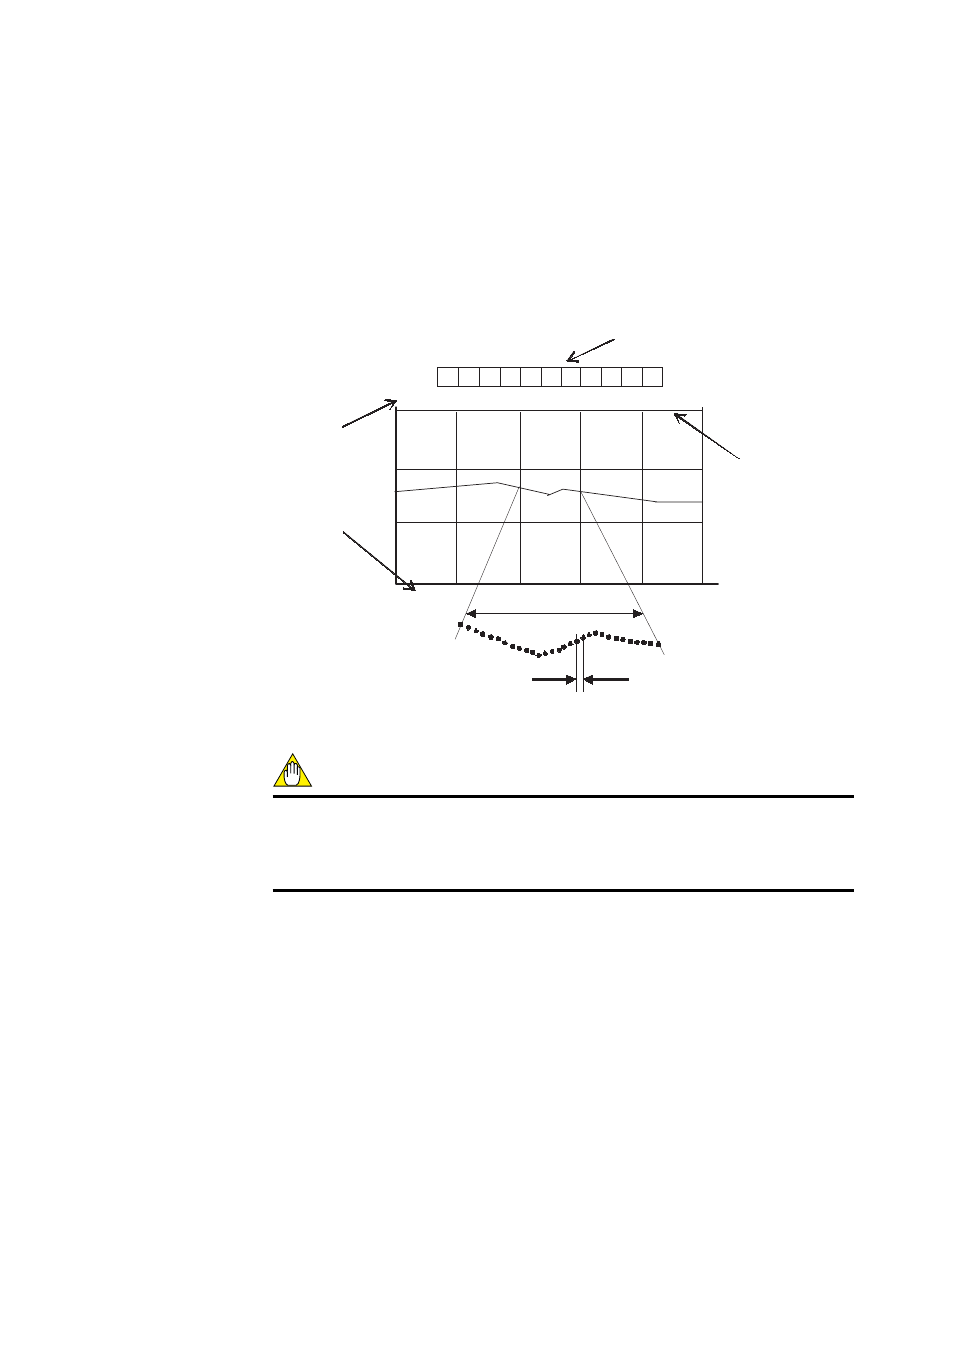
10.2.2 Time Axis of Trend Graph
The time axis of the trend graph is determined by the sampling interval. For each
channel, and for each division on the time axis, 60 data items can be plotted. If data is
sampled at 10-second intervals then each division represents 60 x 10 = 600 seconds or
10 minutes (see Figure 10.6). The sampling interval can be set in the range 1 to 30
seconds. If it is set to 1 second, then trend graph time span is 60 x 1 x 5 = 300 seconds
(5 minutes) and if set to 30 seconds, then trend graph time span is 60 x 30 x 5 = 9000
seconds (50 minutes).
25.0%O
2
10min./div.
0.0%O
2
60 data
Sampling interval
Preset upper limit
Preset lower limit
1 2 3 4 5 6 7 8 a b c
Correspondence : Channel no. to color
F10.6E.eps
Time per division.,
calculated from
sampling interval
Fig. 10.6
CAUTION
If a rapid change in the measured value occurs during sampling, no sampled data are
plotted on the graph. Use the graph indication tentatively. Check the output current for
accurate data.