2 calibration gas, 2 thermocouple voltage, 3 cold junction resistance (c.j. voltage) – Yokogawa Multi Channel Oxygen Analyzer System ZR22/AV550G User Manual
Page 164: 4 cell temperature, 5 c. j. temperature, 6 span-gas and zero-gas correction ratios
IM 11M12D01-01E
10-2
10.1.2 Thermocouple Voltage
The cell temperature is measured with a Type K (chromel-alumel) thermocouple. The
thermocouple cold junction is located in the detector terminal box. The cell temperature
and the thermocouple voltage (including the voltage corresponding to the cold junction
temperature) are displayed.
10.1.3 Cold Junction Resistance (C.J. Voltage)
The ZR22 Detector measures the cold junction temperature using an RTD (Pt 1000).
(The earlier model of Z021D uses transistors to measure the cold junction temperature.)
If “Detector is ZR22” is selected in the Basic setup display, the RTD resistance values
will be displayed. If Z021D is selected, the transistor voltage will be displayed.
10.1.4 Cell temperature
This displays the cell (sensor) temperature, which is determined from the thermocouple
emf and cold junction temperature. Normally it is 750
؇ C.
10.1.5 C. J. Temperature
This indicates the detector terminal box temperature, which compensates for the cold
junction temperature for a thermocouple measuring the cell temperature. When the ZR22
Detector is used, the maximum C. J. temperature will be 150
ЊC. If the terminal box
temperature exceeds this, take measures to shield the terminal box from heat radiation.
The maximum C. J. temperature varies depending on the type of detector.
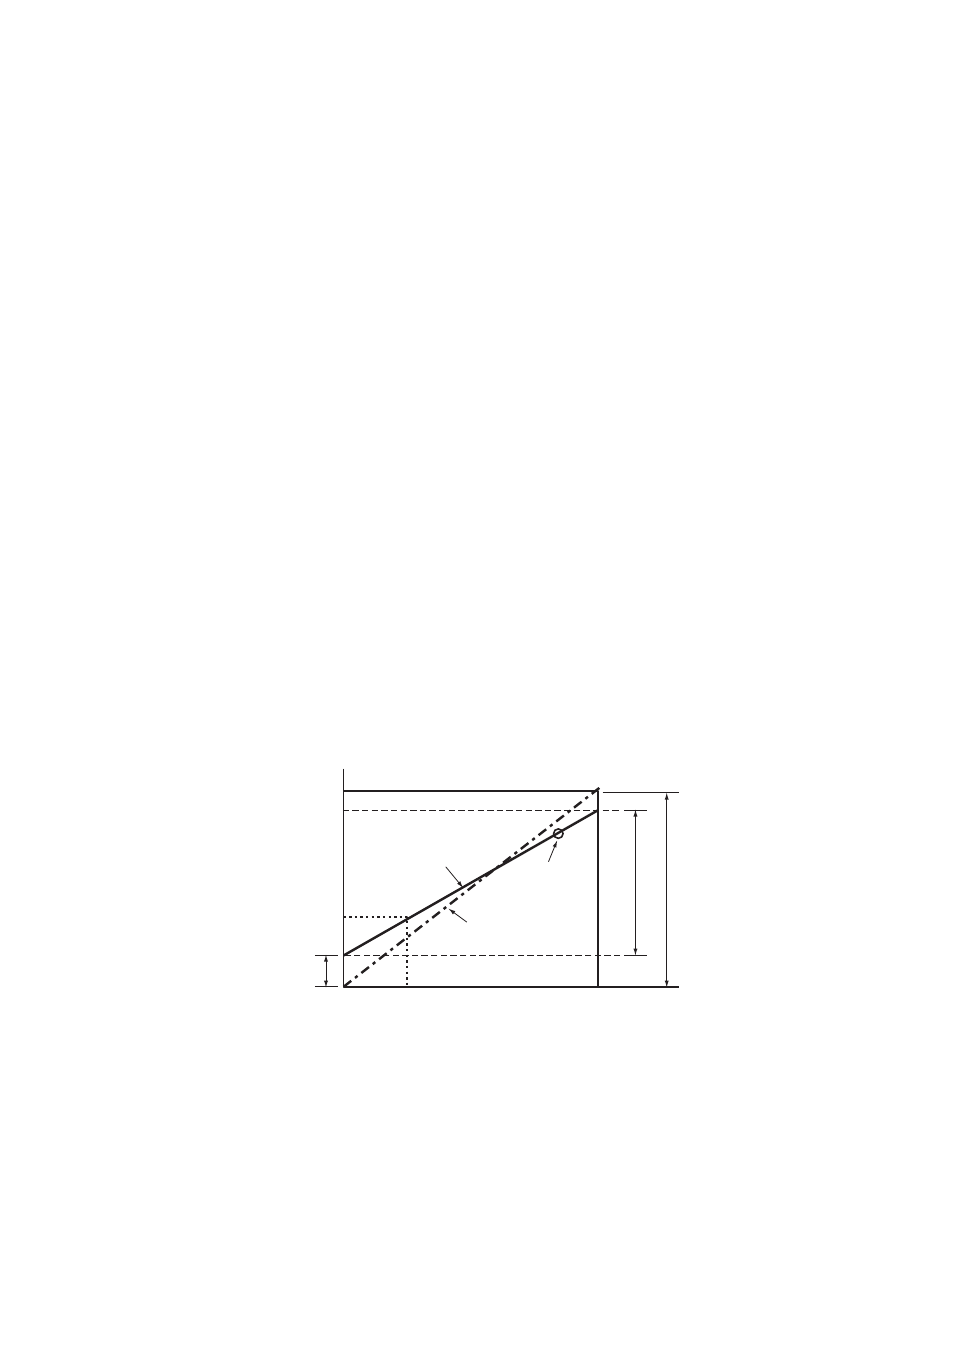
10.1.6 Span-gas and Zero-gas Correction Ratios
These are used to check for degradation of the sensor (cell). If the correction ratio is
beyond the limits as shown in Figure 10.2, the sensor should no longer be used.
These ratios can be found by calculating the data as shown below.
21.0
p1
0.51
81.92
ez
e1
es
0
C
A
B
Zero-gas ratio = (B/A) x 100 (%) Correctable range: 100
±
30%
Span-gas ratio = (C/A) x 100 (%) Correctable range: 0
±
18%
Cell
electromotive
force, mV
Calibration curve
before correction
Previous
zero-gas data
Corrected calibration curve
(theoretical calibration curve)
Zero origin
Span origin
Span-gas
concentration
Oxygen concentration (vol%O
2
)
F10.2E.EPS
Figure 10.2