3 power and ground wiring, 4 power wiring to detector heaters – Yokogawa Multi Channel Oxygen Analyzer System ZR22/AV550G User Manual
Page 106
IM 11M12D01-01E
6-8
2) Detailed data display
To move to the detailed data display, touch the Detailed Data key and then touch the
indication area of the desired channel in the multi-channel display, or simply touch the
Detailed Data key in the single-channel display. The detailed data display shows
maintenance data, such as cell electromotive force, cell temperature, and calibration
history, per channel
Tag:
Ch1
21.0
%
Ch2
21.0
%
Ch3
21.0
%
Ch4
21.0
%
Ch5
21.0
%
Ch6
21.0
%
Ch7
21.0
%
Ch8
20.7
%
Tag:
Ch1
21.0
%
O
2
Ave-a 21.0 %O2
Ave-b 21.0 %O2
Ave-c 21.0 %O2
1
2
Ch1
Cell voltage:
0 . 9 mV
Thermo voltage:
2 9 . 4 mV
C.J.resistance: 1 1 7 0 . 2
⍀
Cell temperature: 7 5 0
Њ
C
C.J.temperature: 4 3
Њ
C
Warmup
Hold
Figure 6.7 Detailed Data Display
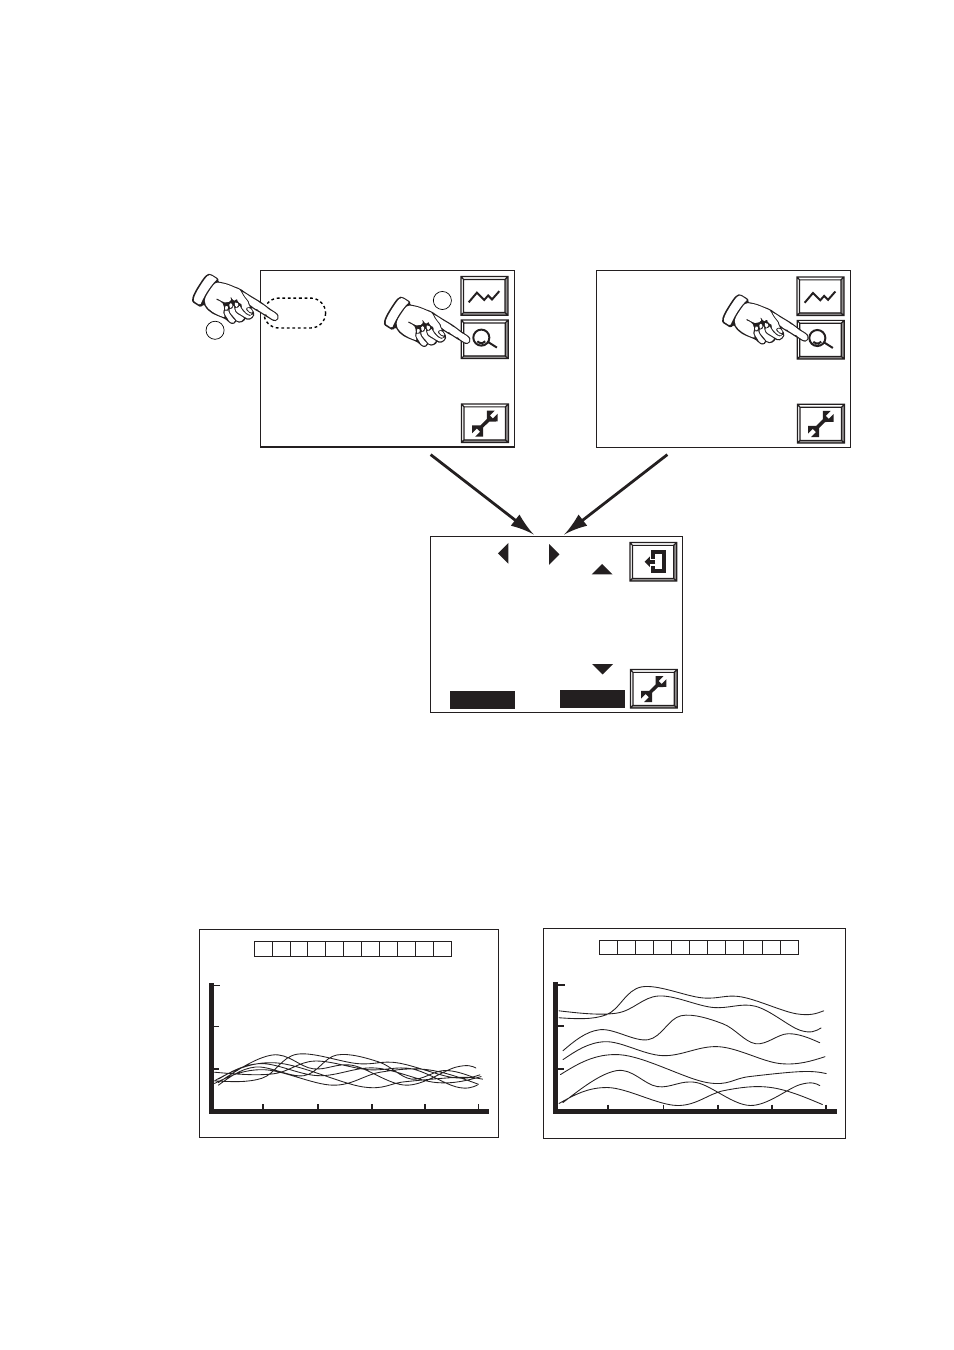
3) Trend graph display
Up to 11 user-selected data from among the individual outputs from each channel and
average concentration outputs, groups a, b, and c, can be viewed in graphical format at a
time in a single screen. To move to the trend graph display, touch the graph display key
on a basic panel display. The cascade function may be used to view each trend line of
channels clearly in the trend graph display. The function offsets the axes so that trend
lines do not overlap.
F0608.eps
0.0 %O2
25.0 %O2
30min./div.
1 2 3 4 5 6 7 8 a b c
F0609.eps
30min./div.
1 2 3 4 5 6 7 8 a b c
Figure 6.8 Trend Graph Display Figure 6.9 Cascade Display